Your Expert Advisor looks profitable in one backtest and disappointing in another, even though the settings are unchanged. Before assuming the strategy broke, compare the price information each test supplied. A candle can look identical while the sequence of prices inside it changes the trading outcome.
This guide explains how tick modeling affects an EA, or automated trading program, and how to investigate differences without choosing whichever report looks best. The price paths below are hypothetical. No robot was tested for this article, and no live performance is claimed.
A candle summarizes prices, not their full sequence
A tick is an individual market-data update. A candle’s open, high, low and close, often shortened to OHLC, compress many updates into four prices. Those values do not identify every intermediate quote or the precise order of every event.
That missing detail matters when an EA reacts inside a candle. Entries, exits and trailing-stop adjustments can depend on which level appeared first, how often it appeared and the bid-ask quotes available at the time.
Reading only completed candles for the entry signal does not automatically remove this dependence. The position’s stop, target or management rules may still operate between candle openings. Review the entire trade lifecycle, not just the signal calculation.
The same candle can contain opposite outcomes
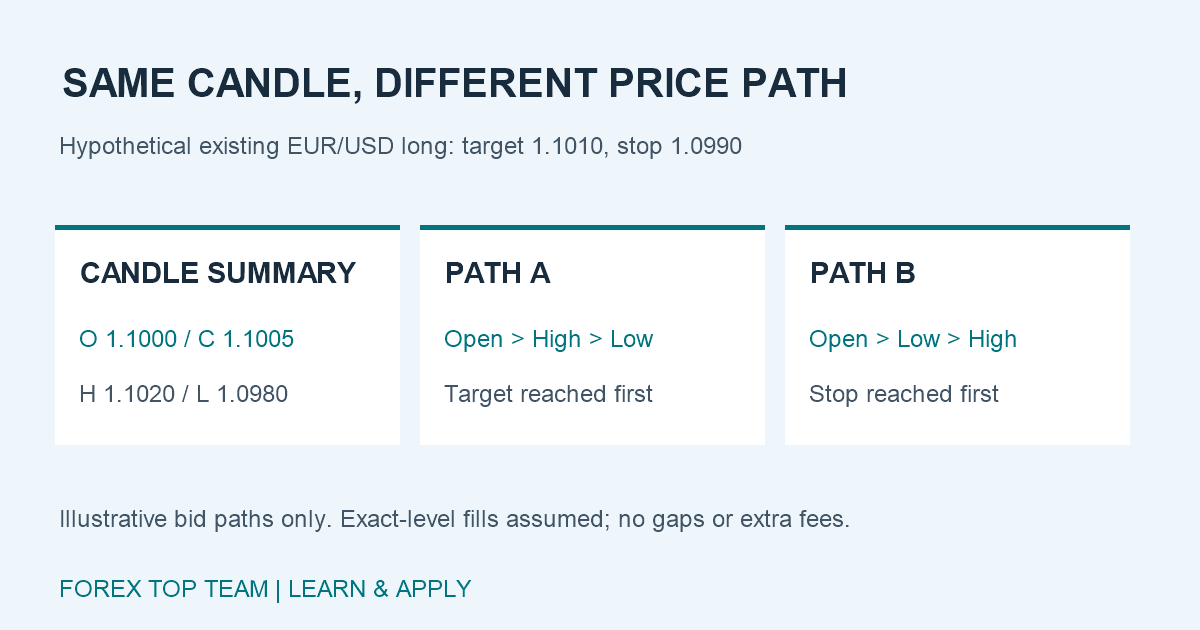
Consider an already-open hypothetical EUR/USD long position. Its actual entry fill was 1.1000 USD per EUR, with a stop at 1.0990 and a target at 1.1010. Assume both exits are checked against the bid and execute exactly at their levels, without gaps or extra fees.
A subsequent bid candle has open 1.1000, high 1.1020, low 1.0980 and close 1.1005. Two illustrative paths fit those same four values:
- Path A: open, high, low, close. The target is encountered before the stop.
- Path B: open, low, high, close. The stop is encountered before the target.
For EUR 10,000 of exposure, a conventional 0.0001 EUR/USD pip is worth $1. The target gives a $10 price gain, while the stop gives a $10 price loss. The outcome difference is $20 despite identical candle summaries.
These paths illustrate missing information; they are not claims about the exact path generated by any particular testing mode. Real quotes can skip levels, spreads can change, and execution can differ from these deliberately simple assumptions.
Know what the modeling mode supplies
MetaTrader 5’s real-and-generated-ticks guide distinguishes broker-provided tick history from ticks generated using minute records. It also explains that real-tick spreads can vary within a minute, while generated ticks use a spread fixed for the relevant minute.
More generated updates do not make a reconstructed sequence an observed historical sequence. Similarly, selecting a real-tick mode does not establish that every minute contains original ticks: the guide documents generation when minute bars exist without matching tick data.
The MQL5 testing reference describes rough modes such as one-minute OHLC and open-prices-only, including limitations on EA event processing. Fast screening and detailed validation serve different purposes. Match the mode to the behavior you need to evaluate.
Find the first disagreement, not just the last balance
Save both reports, trade lists and journals. Freeze the EA version, parameters, dates, symbol, broker server, account currency, sizing and execution assumptions. If several inputs changed, the final-profit difference cannot be attributed solely to tick modeling.
Compare the first trade where the runs diverge. Did one run generate a signal the other missed? Did an exit occur earlier? Did the spread prevent entry? Did a trailing stop move before the price reversed?
For that short window, inspect timestamps, both quote sides and the EA’s recorded decisions. Visualization can help, but the journal and quote evidence should support the explanation. Label an unexplained difference as unresolved rather than inventing an execution story.
An early divergence can alter everything afterward. Different equity can change position size, and an open position can prevent another entry. Later trades may no longer be directly comparable, even if the original cause involved only one minute.
Turn sensitivity into a review decision
If the strategy depends heavily on an assumed intrabar path, ask whether that dependency is part of the intended idea. A system designed to respond to rapid quotes needs evidence at that resolution. A slower strategy may still require accurate exit handling.
Do not repeatedly adjust parameters until the detailed test recreates the attractive coarse result. If you change the rules, version the change and reserve fresh evidence for evaluation. Otherwise, validation becomes another round of historical tuning.
Recorded ticks also do not recreate every feature of live trading. Network delays, available size and broker execution conditions still need separate review. Our EA trading-cost stress guide explains how to extend the investigation beyond the price-data mode.
Your practical checklist
Record the mode and data source; check coverage and journal warnings; freeze other assumptions; inspect the first divergent trade; then review the equity path and costs. Keep unresolved questions visible alongside the result.
The aim is a strategy whose behavior you can explain, not a report that wins a screenshot comparison. Next, run a monitored demo test with the same frozen rules and compare its decisions with your documented assumptions. That adds evidence about behavior without guaranteeing future profitability.