Your Expert Advisor shows a steady profit in a backtest. Then you increase the assumed trading costs, and much of that profit disappears. Does that mean the strategy is useless, or that the first test asked the wrong question?
A cost stress test helps you find out how much room the strategy has before its assumptions become uncomfortable. It is particularly useful when an EA, or automated trading program, aims to capture small moves repeatedly.
We will build a simple review process using hypothetical figures. No robot has been tested for this article, and the examples are not performance claims or current broker quotes.
Start by knowing what the result includes
Before changing anything, list the EA version, parameter file, broker data source, instrument, dates, account currency, position sizing and modeling mode. Save the baseline report and trade list. You need a reproducible starting point, not just a screenshot of the equity curve.
Then check which costs the test actually includes. Executable bid and ask prices may already capture the spread. Commission and overnight financing need their own checks. Do not deduct a spread twice, and do not assume that a report labeled net profit reflects every cost you care about.
The official MetaTrader 5 testing guide notes that its profit-in-pips calculation mode excludes commission and swap calculations. That shortcut should not be treated as a complete cash-account simulation.
Use a small example to expose cost sensitivity
Imagine 200 completed EUR/USD trades, all at a fixed size of 0.10 standard lot. Assume one standard lot is 100,000 euros and the account is denominated in US dollars. One conventional pip is 0.0001 USD per euro, so each pip is worth $1 at this size.
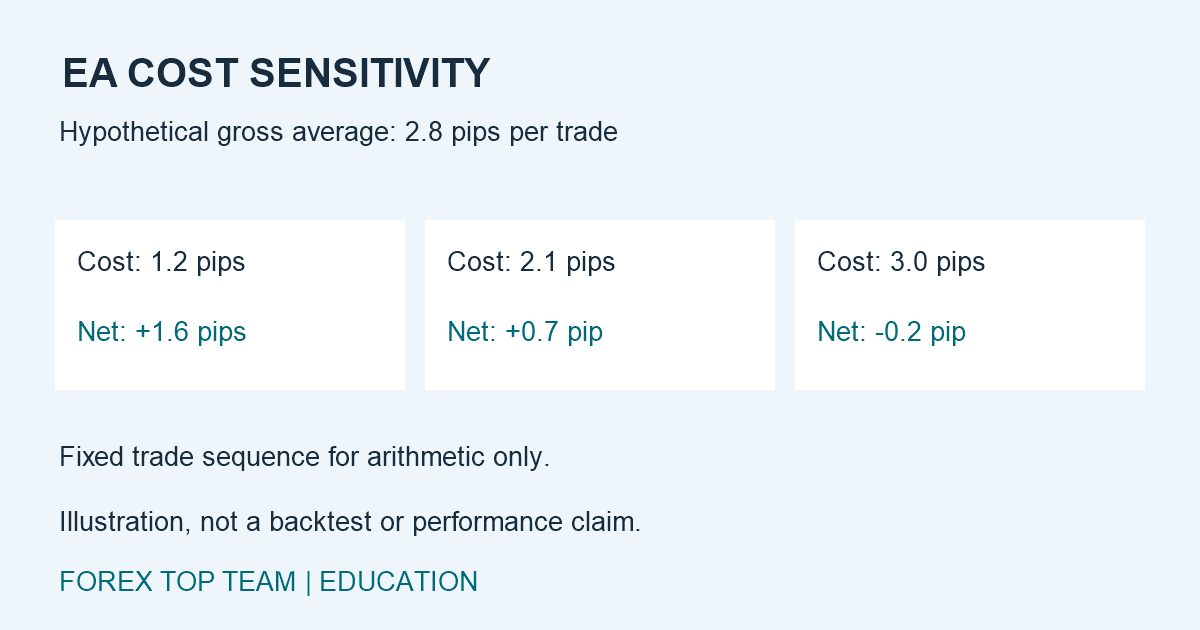
Suppose the average gross result is 2.8 pips per completed trade. Here, gross means a deliberately simplified, pre-cost figure. We hold the trade sequence constant solely to illustrate the arithmetic.
- With an all-in round-trip cost of 1.2 pips, the average net result is 1.6 pips. Across 200 trades, that equals $320.
- With a cost of 2.1 pips, the average net result is 0.7 pip, or $140 across the same trades.
- With a cost of 3.0 pips, the average net result is minus 0.2 pip, or minus $40.
The simplified break-even cost is 2.8 pips. It is an arithmetic threshold, not a forecast of what a broker will charge. Realistic reruns may produce different signals, fills and trade counts, so subtracting a flat cost from the original result is only an initial sensitivity check.
Change one assumption, then compare the combination
Define scenarios before looking at their results. Start with observed or documented costs for the intended account, then consider an adverse spread or commission assumption that you can explain. Label any invented stress level clearly.
First change one input at a time. That lets you see whether a result is especially sensitive to spreads, financing or execution timing. Afterward, test a combined adverse scenario. Costs may worsen together during difficult conditions, and separate tests can miss that interaction.
Do not quietly optimize the parameters after each unfavorable run. That turns a robustness check into another search for attractive historical results. If you change the strategy, version the change and treat it as a new candidate.
Tick data and execution timing deserve separate tests
If the EA makes decisions inside a candle, a few modeled prices may not reproduce the sequence it depends on. MetaTrader’s real and generated ticks documentation explains that real ticks can contain changing spreads within a minute, whereas generated ticks use a spread fixed within the relevant minute.
Record whether genuine tick history is available for the period you test, and inspect the journal for data issues. A more detailed mode provides more information, but historical ticks still do not recreate every aspect of a live trading venue.
Execution delay is another variable. The testing guide describes fixed and random delays that simulate time between an EA request and execution. Delay is not identical to adding a fixed number of slippage pips. Price movement during the delay can change the outcome in either direction, and pending-order handling has specific limitations documented by the platform.
Look beyond the final profit number
Put the baseline and stress scenarios side by side. Record net profit, maximum equity drawdown, trade count and average net result per trade. Inspect which trades changed rather than treating every difference as a simple fee deduction.
A strategy may remain profitable overall while most of its gain comes from a small cluster of trades. Break the report into meaningful periods and trading sessions. Look for dependence on unusually favorable conditions, without removing the difficult periods merely to improve the presentation.
For broader execution context, our FX execution-quality guide explains why the advertised spread is only one part of the trading experience.
Keep some evidence outside the tuning process
Choose your acceptance criteria before evaluating a separate historical period. For example, define what drawdown or cost sensitivity would make the strategy unsuitable for your plan. There is no universal threshold that makes an EA safe.
If you repeatedly examine the reserved period while changing settings, it gradually becomes part of the tuning data. Keep a record of the attempts. An untouched period and a monitored demo forward test can provide additional evidence, but neither guarantees future profitability or live execution quality.
Your next step is practical: save one baseline, one single-cost stress and one combined stress report. Explain the differences in plain language. A credible EA review should tell you what the strategy depends on and where its evidence becomes weak, not simply display its best curve.