Your currency scanner shows a strong euro, but one spectacular cross is doing most of the work. How much confidence should you place in the ranking? Before selecting an FX pair, inspect how widely the move is shared across counterparts. A simple breadth and concentration review can distinguish a broadly supported move from an average dominated by one unusual observation.
Keep the ranking and its ingredients together
The CurrencyPower Meter compares eight currencies across 28 pairs. Its description uses H4 for the ranking, with H1 and D1 providing additional context, and describes each currency’s strength as the average percentage change of its seven pairs. Save the displayed values, settings and observation time before opening candidate charts.
A rank is an ordering. The numerical distance between currencies contains different information. Two currencies can swap ranks after a tiny change when their scores are close. For a review, record both the rank gap and the underlying score gap. Keep all comparisons on the same timeframe and lookback so a short impulse is compared with observations from the same horizon.
Define breadth as the number of counterparts against which the currency appreciated during your chosen window. State how you treat nearly unchanged pairs. For example, a predeclared threshold can classify a tiny move as flat. Apply the same threshold to every observation in the sample and retain the raw returns so another reviewer can reproduce the classification.
An average can hide concentration
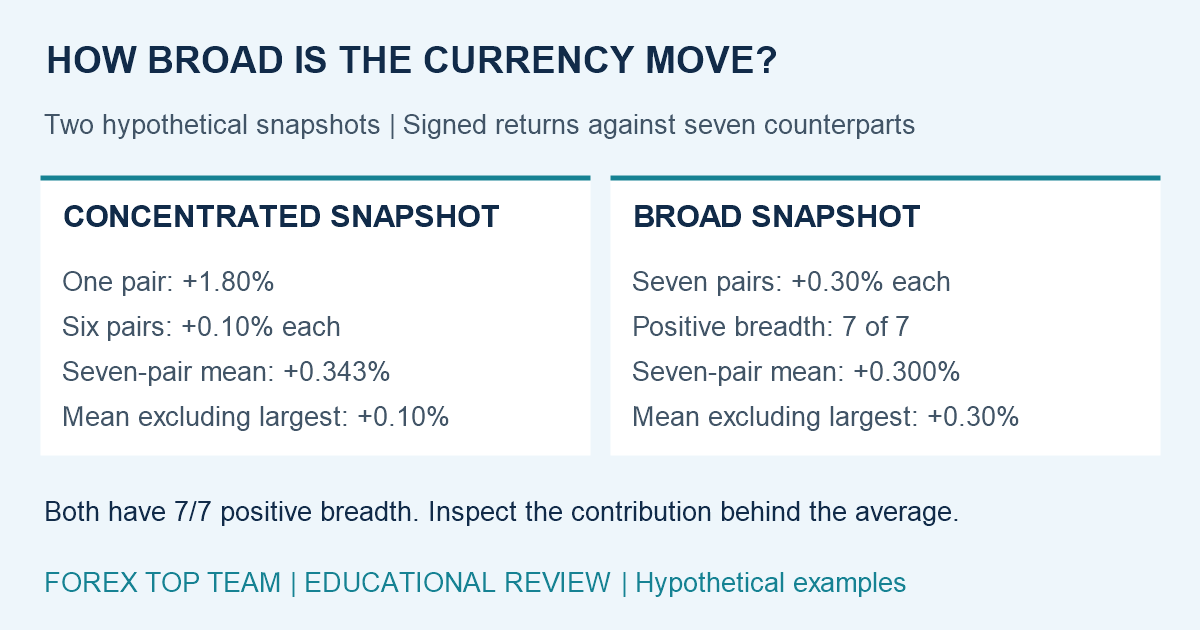
Consider two hypothetical snapshots of one currency against seven counterparts. Express every return from that currency’s perspective, with appreciation positive. In Snapshot A, the changes are plus 1.80% against one counterpart and plus 0.10% against each of the other six. The arithmetic mean is 2.40% divided by seven, or approximately 0.343%. In Snapshot B, all seven changes are plus 0.30%, giving a 0.300% mean.
Snapshot A has the higher average, while both snapshots have positive breadth of seven out of seven. Now remove the largest positive observation as a diagnostic. The remaining six-pair mean in A is 0.10%. In B, it remains 0.30%. The largest observation accounts for 75% of A’s summed positive changes, compared with about 14.3% in B. These figures describe concentration in invented data. They are not probability estimates or a reconstruction of the meter’s internal calculation.
This diagnostic has limits. When some returns are negative, dividing the largest return by a small net sum can produce an unstable concentration number. In that case, show the full seven-return list and the largest contribution to the sum of positive returns. Keep the sign count and the six-pair mean alongside it so one percentage does not carry the entire interpretation.
Put every quote in the same direction
A higher EUR/USD quote means the euro buys more dollars. A higher USD/JPY quote means the dollar buys more yen. When reviewing yen strength, that second quote must be put into the yen’s perspective. MetaTrader’s basic trading principles explain the buy and sell sides of currency positions. Preserve the quote convention in your worksheet.
Percentage inversion also needs care. If a quote rises by 1%, its reciprocal changes by 1 divided by 1.01 minus one, approximately minus 0.9901%. Simply changing the sign is an approximation. For a manual audit, invert the price series first when required, then calculate its percentage change. Use a consistent price type and synchronized timestamps across the seven pairs.
Check data coverage before interpreting a missing or extreme reading. A stale symbol, an incorrect suffix, or a history gap can turn a data problem into an apparent macroeconomic story. Keep missing observations visible and record which pairs were available when you made the decision. A completed chart later in the day can contain data that your terminal had not loaded at the earlier scan.
Use concentration to form a question
Suppose the outlying move is concentrated in a yen cross. Review whether the event was mainly yen-driven and whether the proposed trade depends on that same event continuing. Then examine the currency’s other crosses. A concentrated move can still produce a tradable setup, but the journal should identify the specific counterpart and catalyst carrying the thesis.
The seven pairs also share a currency leg, so seven positive changes are related observations. Counting them as seven independent confirmations would overstate the evidence. A broad reversal in the common currency can affect several positions together. Before trading multiple candidates, write down the combined account-currency loss at their planned stops and the additional exposure to execution gaps.
Make the next scan auditable
Save a compact record containing the scan time, timeframe, lookback, ranked scores, seven signed returns, breadth, largest positive contributor, six-pair mean and selected pair. Add the actual entry condition separately. The meter can narrow your search, while the chosen trading method supplies its own trigger, stop and management rules.
The Forex Top Team Trading Toolkit combines the scanner with Navigator indicators and semi-automatic Assist EAs. Use the breadth review as a journal exercise when choosing among the displayed candidates. The related guide From Currency Strength to a Tradeable Pair connects that shortlist to chart structure and shared exposure. Together, the records let you test whether broad or concentrated observations actually led to better decisions in your own sample.