The US ten-year Treasury yield rises, so you assume the dollar should rise too. Sometimes that interpretation fits. Sometimes it misses the reason the bond market moved. A higher long-term yield can reflect a different expected rate path, a changing risk premium, or a mixture of both.
This guide gives you a practical way to separate those possibilities before interpreting an FX move. All numerical examples are hypothetical. No current Treasury yields, policy forecasts or currency prices are being reported.
One yield can carry more than one message
A yield is the return implied by a bond’s price under its cash-flow conventions. It is not the same thing as today’s central-bank policy rate. A ten-year security reaches far beyond the next policy meeting.
In a simplified decomposition, a long-term yield combines an expected average of future short-term rates with a term premium. The term premium is the additional compensation, which can also be negative, associated with holding longer-term interest-rate exposure rather than repeatedly investing at short maturities.
The New York Fed’s discussion of Treasury-market signals explains that these components are not directly observable. Separating them requires estimates. Seeing the yield rise does not, by itself, tell you which component changed.
The same increase, two different stories
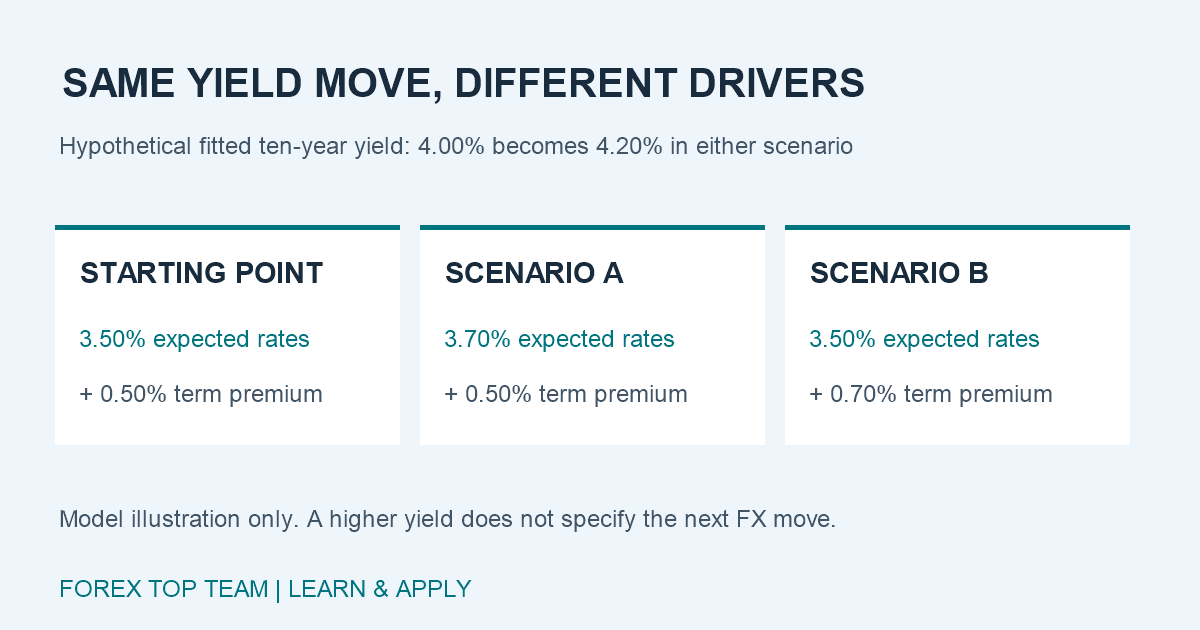
Imagine a hypothetical fitted ten-year yield of 4.00%, represented by a 3.50% expected-rate component and a 0.50% term premium. This is illustrative model arithmetic, not a decomposition of an actual quoted coupon bond.
- Scenario A: the expected-rate component rises to 3.70%, while the premium stays at 0.50%. The fitted yield becomes 4.20%.
- Scenario B: the expected-rate component stays at 3.50%, while the premium rises to 0.70%. The fitted yield also becomes 4.20%.
Both increases are 0.20 percentage point, or 20 basis points. One basis point is 0.01 percentage point. But only Scenario A, as defined, contains a change in the expected average short-rate component.
Neither scenario specifies the next policy decision. An average over ten years can change because expectations far beyond the next meeting have shifted. Nor does either scenario imply a fixed dollar move. This exercise shows why a single yield chart cannot settle the explanation.
Use model estimates with their labels attached
The New York Fed’s Treasury Term Premia page provides model estimates alongside fitted yields and expected average short rates. These are useful for examining a longer-running pattern, provided you keep their assumptions and observation dates visible.
A fitted yield is a model’s representation of market information. Do not casually combine one model component with an unrelated par yield and expect an exact identity. Match maturity, yield definition, data date and model version.
Also avoid using a published daily estimate as if it explained a minute-by-minute currency swing. The estimate may concern a different observation window. For intraday analysis, record that limitation rather than assigning the entire move to a premium you have not measured at that time.
Add a second lens: real yields and inflation compensation
Treasury Inflation-Protected Securities, or TIPS, adjust their principal with inflation under the instrument’s rules. Their yields are commonly described as real yields. Comparing a fitted nominal yield with a fitted TIPS yield of the same maturity gives a measure of inflation compensation.
The Federal Reserve’s TIPS yield-curve explanation describes this comparison. Inflation compensation should not be treated as a pure forecast: risk compensation also affects the interpretation.
Suppose matched hypothetical nominal and real yields move from 4.00% and 1.50% to 4.20% and 1.55%. Their difference rises from 2.50 to 2.65 percentage points. Of the 20-basis-point nominal increase, 5 basis points accompany the real-yield change and 15 accompany the compensation change.
This is a different lens from the expected-rate/term-premium decomposition. Do not add all four components together; that would mix overlapping explanations. Use each framework to ask a distinct question.
Bring the other currency back into view
FX is a relative price. For USD/JPY, a US yield observation is only one side of the comparison. If you compare government yields, use matching maturities and aligned timestamps, then consider whether the instruments have comparable meanings.
A wider nominal spread does not guarantee a stronger dollar. Its source, expectations already embedded in prices, hedging costs and other market conditions can matter. A statistical relationship over one period does not make the spread a mechanical trading signal.
Our guide to currency reactions after rate hikes adds the expectations question: what changed relative to the outlook recorded before the news?
A worksheet for the next yield move
Write down the maturity, yield convention, source, observation time and timezone. Then separate what you observed from your explanation. Record the nominal move first; add available evidence about the rate path, term premium or matched TIPS comparison afterward.
If evidence is missing or conflicting, keep more than one hypothesis. Check the other currency and the actual FX response, but do not use that response as proof of a bond-market cause. Several pieces of news may arrive together.
Your practical takeaway is to ask why the yield changed before asking what it means for FX. Next, practice comparing the two decompositions on a consistent historical window. Better labels and aligned observations make the analysis more useful without pretending that bonds dictate every currency move.