You win eight trades out of ten, yet your account keeps shrinking. The contradiction disappears when you look at how much each winner earns and how much each loser costs. Win rate counts outcomes; it does not weigh them.
This guide shows how to combine win rate with average profit, average loss and trading costs. The examples are hypothetical, not results from a live account or an advertised EA. You can use the same worksheet to review discretionary trades or an automated strategy.
Count wins, then measure their size
Win rate is the number of profitable trades divided by the number of trades included in your calculation. Define a trade consistently: several partial exits from one position should not quietly become several independent winning ideas.
Next, calculate the average cash profit among winners and the average cash loss among losers, using the loss as a positive magnitude. MetaTrader 5’s testing-report guide lists these separately from the percentage of profitable trades. They answer different questions.
Use one account currency and a consistent treatment of costs. A twenty-pip result on one position may not have the same cash value as twenty pips on another. Different sizes and currency-conversion rates can make a raw pip average misleading.
An 80% win rate with a negative result
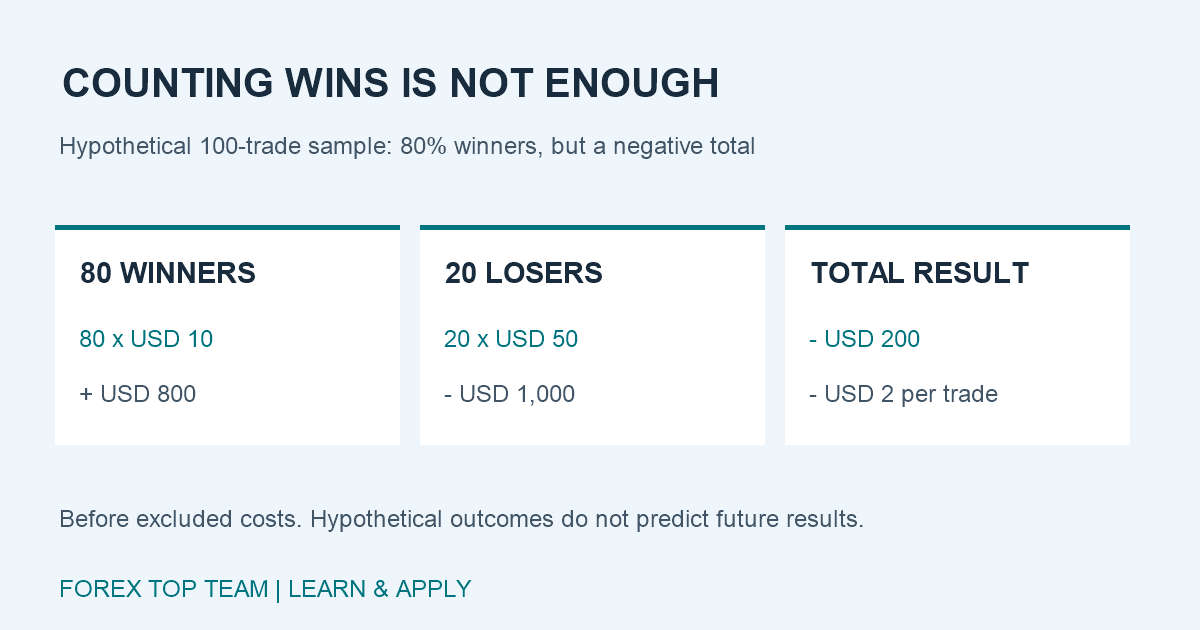
Imagine 100 hypothetical completed trades in a USD account, with no zero-result trades. Eighty winners earn an average $10 each, while twenty losers lose an average $50 each. For this first calculation, the amounts exclude commissions and financing.
- Winning trades contribute 80 x $10 = $800.
- Losing trades subtract 20 x $50 = $1,000.
- The total result is -$200, or -$2 per trade, before the excluded costs.
You were profitable on 80% of individual trades, but each average loser erased five average winners. There is no accounting inconsistency. Frequency and size combine to produce the result.
The weighted average can be written as: win fraction x average win – loss fraction x average loss. Here it is 0.80 x $10 – 0.20 x $50 = -$2. This reproduces the sample’s average; it does not establish what the next trade will earn.
Calculate the win rate needed to break even
If the two average payoff amounts stayed fixed and there were no zero-result trades or additional costs, the break-even win fraction would be average loss divided by average win plus average loss.
In our hypothetical example, $50 / ($10 + $50) is approximately 83.33%. The observed 80% is below that threshold. If a separate, fixed $1 cost applied to every trade, the arithmetic threshold would become ($50 + $1) / ($10 + $50), or 85%.
That extra dollar would also reduce the sample result from -$200 to -$300. Do not subtract it twice: if your recorded trade outcomes already include every relevant cost, calculate directly from those net outcomes.
This threshold is conditional arithmetic, not a performance target you can achieve by deciding to win more often. Changing an exit rule changes the distribution of both winners and losers. Taking profit sooner might raise win rate while making average winners smaller.
Use profit factor as a cross-check
Profit factor compares the sum of positive trade results with the magnitude of negative trade results. The official MQL5 statistics reference documents that ratio and the average-payoff statistic.
For the first hypothetical sample, profit factor is $800 / $1,000 = 0.80. That agrees with the negative total. A value above one would show a positive result under the included accounting assumptions, but would not prove that future trading is profitable or suitably sized.
Use identical trades and cost conventions when comparing these figures. A cash-based profit factor and an average expressed in pips can tell different stories when position sizes vary. Reconcile the report with the underlying trade list before drawing conclusions.
Inspect the losses behind the average
Two samples can share an average loss while having very different worst trades. One might contain frequent moderate losses; another might contain a rare, much larger loss surrounded by tiny ones. Examine the largest losses and their causes.
Were exits delayed? Did exposure increase after an adverse move? Did several trades depend on the same currency? These questions help distinguish a repeatable strategy rule from an occasional exception that dominates the account.
Closed-trade statistics also leave open positions outside the count. Our balance-versus-equity guide explains how floating losses can coexist with a comfortable-looking record of completed winners.
Turn the numbers into a useful review
Keep the observation period, trade definition, sizes and costs beside your calculation. Split the record into chronological periods and ask whether the same payoff pattern persists. A favorable sample is evidence about that sample, not a guaranteed probability for future trades.
For an EA, judge the rule on data that did not guide its settings, then compare monitored demo execution with its assumptions. Avoid repeatedly adjusting the system simply to make one headline statistic more attractive.
Your practical checklist is short: count consistently, measure cash outcomes, include costs once, inspect the biggest losses and review open exposure. Next, connect those observations to position sizing and drawdown. The goal is to understand the full payoff pattern before letting a high win rate influence your risk budget.