You check an official exchange-rate table, then open your trading platform and see a different number. Is one of them wrong? Before judging the difference, ask what each rate is designed to represent.
A reference rate can be useful for consistent historical comparisons without being a price you can trade. Understanding that distinction helps you review fills, compare charts and avoid building a strategy around an unavailable entry. All numerical examples below are hypothetical, not current market observations.
An official rate is not an offer to trade
The ECB’s euro reference-rate page says its rates are published for information and discourages using them for transactions. It describes a central-bank procedure normally around 14:10 CET, with publication usually around 16:00 CET on working days except TARGET closing days.
Those two times describe different stages: establishing a reference and publishing it. A rate appearing on a website is not necessarily an observation of the market at the moment you open the page. Read the dated table and methodology, not just the latest visible number.
This does not make the series useless. A consistently defined daily reference can help you compare currency changes over time. The mistake is treating that statistical observation as an immediately available buying or selling price.
Compare the same side of the quote
Retail trading platforms normally show a bid and an ask. In plain language, the bid is the quoted price at which you sell the base currency, and the ask is the quoted price at which you buy it. Their difference is the spread.
OANDA Corporation’s bid-and-ask guide explains this convention. Check the specifications for your own instrument and account when applying it. A displayed quote is still distinct from the actual execution recorded for your order.
The midpoint is the arithmetic average of bid and ask. It is handy for describing a quote, but averaging two available sides does not create a third executable price. A chart or converter may use a midpoint, a bid or a daily average; its label matters.
A hypothetical difference with three parts
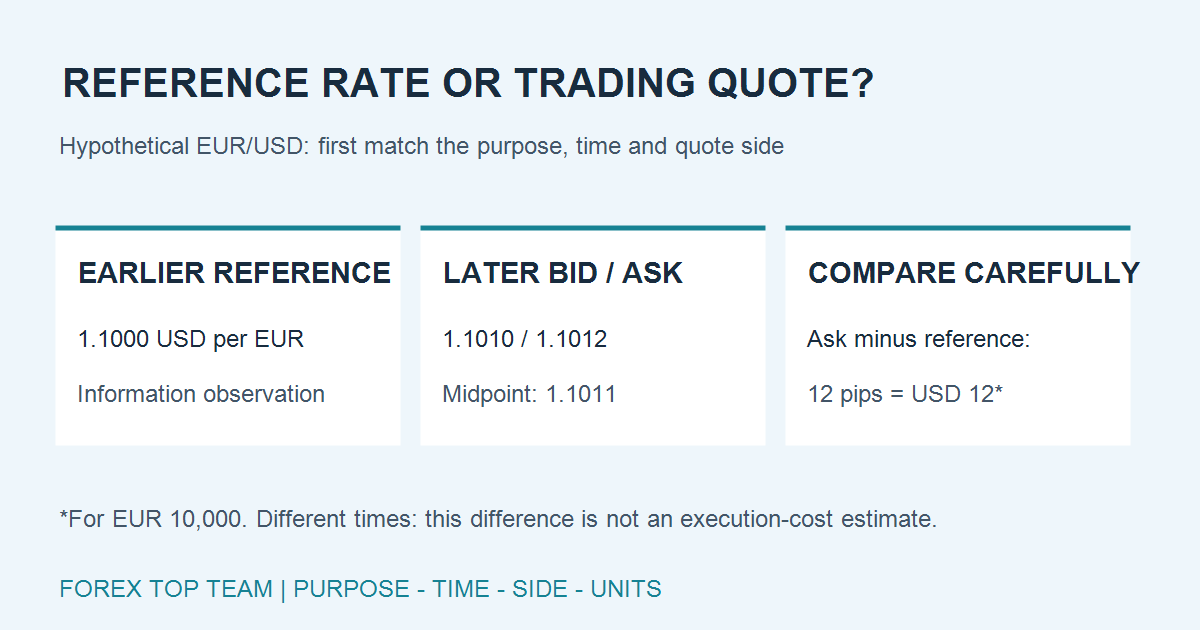
Imagine a hypothetical EUR/USD reference observation of 1.1000 dollars per euro at an earlier time. Later, your platform displays a bid of 1.1010 and an ask of 1.1012. Its midpoint is 1.1011, and its spread is two pips, where one pip is 0.0001 dollar per euro.
Comparing the earlier reference with the later ask produces a 12-pip difference. For buying EUR 10,000, that is USD 12: 10,000 x 0.0012. But it would be misleading to label the whole USD 12 a broker execution charge.
First, the observations come from different times. Second, the ask sits one pip above the later midpoint. Third, the reference and platform may follow different construction methods or draw on different observations. Our simplified arithmetic cannot isolate those components without matched evidence.
If you wanted to evaluate execution, you would need the relevant quote at order submission or arrival and the actual fill, with matching direction and size. An earlier official reference cannot substitute for that record. Keep commission and financing separate from a price comparison.
Watch the direction of the currency pair
The ECB table uses the euro as base currency. A hypothetical USD entry of 1.1000 therefore means USD 1.1000 for EUR 1. It does not mean EUR 1.1000 for USD 1.
Reversing the quotation requires a reciprocal: 1 / 1.1000 is approximately 0.9091 euros per dollar. Multiplying dollars by the original number would answer the wrong conversion question.
For bid-ask quotes, inversion also switches the sides. A hypothetical EUR/USD quote of 1.1000 bid and 1.1002 ask corresponds to an inverted USD/EUR bid of 1 / 1.1002 and ask of 1 / 1.1000. Preserve enough precision and round only for display; otherwise small differences can be rounding artifacts.
Build a comparison you can actually audit
Write down the source, instrument, units, quote side, observation date and timestamp with timezone. Record publication time separately when a series is released after its observation. For your broker, preserve the ticket and actual fill rather than relying on a chart screenshot taken afterward.
Check whether the source has produced a new observation for that date. A weekend or publication holiday can leave an older rate as the latest available entry. Do not silently carry it forward and describe it as a fresh market quote.
When comparing feeds, align their timestamps and price definitions before measuring differences. If you cannot align them, explain that limitation. A discrepancy by itself does not prove an execution problem or a tradable arbitrage opportunity.
Use each rate for the question it can answer
Use a documented reference series for consistent historical analysis, subject to its limitations. Use account-specific quotes and fills to investigate trade execution. Use the relevant conversion rules when reviewing profits or losses in another account currency.
Our buy-limit guide takes the next step: it shows why a visible chart touch may differ from the quote that matters for an order. Before your next comparison, check purpose, time, side and units. Those four checks often explain more than searching for a single supposedly correct FX price.