An Expert Advisor shows a steadily rising balance curve. Most trades close in profit, and the final result looks attractive. Before you call it a low-risk strategy, ask one more question: what happened to equity while those trades were still open?
A balance curve can leave part of the experience out of view. This guide shows how to read drawdown alongside it, calculate the recovery hurdle and turn those observations into a more useful EA review. The account values are hypothetical; they describe no live strategy or promised performance.
Balance and equity tell different parts of the story
For a simple account with no credit adjustments, balance reflects booked results and cash movements. Equity also includes the marked value of open positions. An unrealized loss can reduce equity before it appears as a closed loss in balance.
Imagine a hypothetical USD account whose balance is USD 10,000. Open positions carry a combined floating loss of USD 2,000, putting equity at USD 8,000 under these simplified assumptions. The balance line has not fallen, but the account already has less equity supporting its exposure.
If the positions later recover and close in profit, the final balance chart may look comfortable. That does not erase the lower equity observed along the way. Margin pressure, the decision to keep holding and the possibility of a deeper move all existed before the eventual exit.
Measure the fall from the right peak
Drawdown measures a fall from a preceding high to a later low. For a chosen equity series, calculate the running peak at each observation, then subtract current equity. Dividing that difference by the corresponding peak gives the percentage drawdown.
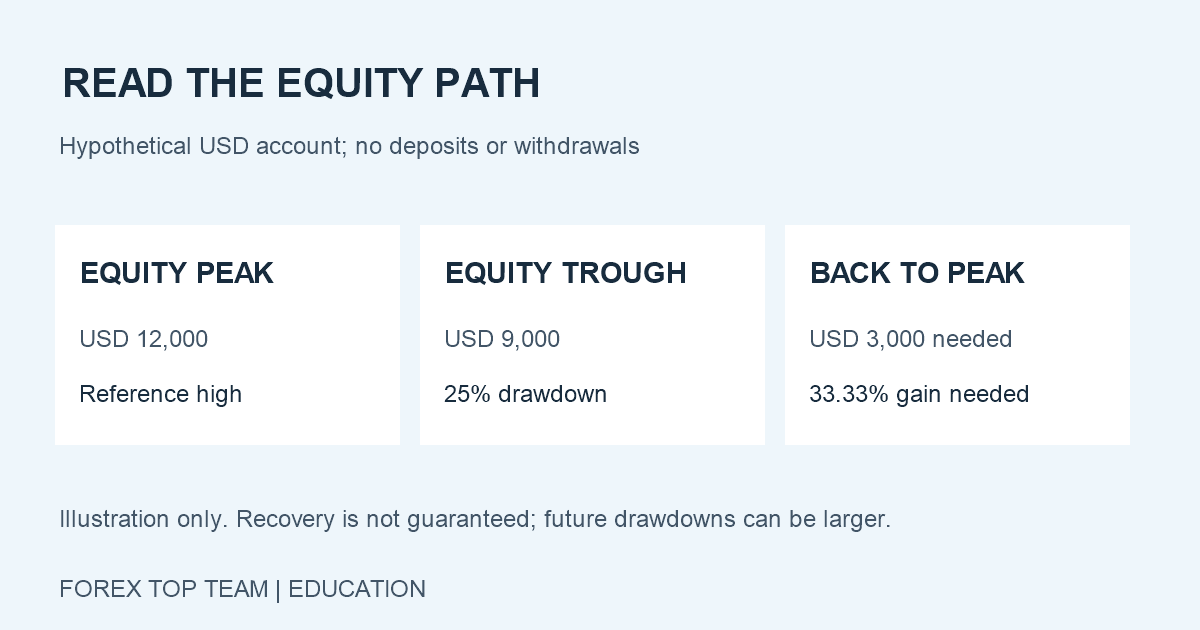
Suppose equity first reaches USD 12,000 and then falls to USD 9,000. The decline is USD 3,000, or 25% of that peak. Dividing by an original USD 10,000 deposit would answer a different question; it would not give the same peak-to-trough percentage.
The official MQL5 testing-statistics reference distinguishes maximum balance and equity drawdowns in cash from maximum relative drawdowns in percent. The largest cash decline and largest percentage decline need not be the same episode. Keep the reported measure and its denominator clear.
For a review with deposits or withdrawals, identify those cash flows before interpreting a raw curve. Adding money can lift account values without representing trading profit. Use a consistent method that separates cash movements from strategy performance.
A loss percentage is not the recovery percentage
Returning from USD 9,000 to the earlier USD 12,000 peak requires USD 3,000 of gains. That is 33.33% of the remaining USD 9,000, even though the preceding drawdown was 25%.
More generally, if the fraction lost is d, the gain needed to regain the same peak is d / (1 – d), assuming no intervening cash flows. A 10% decline needs about 11.11% recovery, a 20% decline needs 25%, and a 50% decline needs 100%.
This arithmetic does not predict recovery time or establish that recovery will happen. It explains why increasing exposure to make back a loss can create a larger problem. A reduced account must earn gains from a smaller base while still facing uncertain future trades.
Ask what the strategy did during the decline
Inspect the trades open near the equity trough. Did exposure grow as price moved against the EA? Were several positions betting on the same currency? Did holding periods extend, or did the program wait for a reversal instead of applying an exit?
Those questions are especially useful when an EA closes many small winners while carrying occasional large floating losses. A high win rate alone cannot establish that the overall loss profile is manageable. The size and timing of losses matter alongside their frequency.
Record the peak exposure, number of simultaneous positions, holding duration and modeled margin conditions. These details help explain the drawdown mechanism rather than treating one headline percentage as the entire risk assessment.
Read the path, not only the worst point
Two systems can share a 20% maximum drawdown but feel very different. One might regain its peak quickly; another might spend much of the test below it. Track time underwater, meaning the interval during which equity remains below a previous high, as well as the depth of the decline.
State how frequently equity was observed. Daily snapshots can miss an intraday low, and a chart built only from closed trades can omit floating losses. A percentage obtained from one sampling scheme should not be compared casually with another.
Historical maximum drawdown is the worst observation in that test, not a ceiling for future losses. Its usefulness depends on the period, market data, trading assumptions and strategy rules represented in the sample.
Make the test harder to fool
Keep a later period separate from the data used to choose settings. The MetaTrader 5 testing guide describes splitting a selected period for forward testing. This historical check is different from running the EA prospectively on a demo account.
Freeze the chosen settings before judging the separate period. Repeatedly changing them after seeing its results weakens the independence of that check. Compare drawdown depth, exposure and recovery behavior across periods, rather than looking only for another profitable ending.
Our EA trading-cost stress guide adds a related check: whether less favorable execution assumptions change the result. Cost stress and equity-path review answer different questions, so use both.
Your next EA review
Put balance and equity on the same timeline, verify the drawdown definition and calculate the recovery hurdle. Then examine the positions behind the trough and the time spent below the peak. Keep assumptions and cash flows visible in your notes.
The aim is not to find a curve that never declines. It is to understand the exposure you would actually be taking and decide whether the evidence supports your plan. Next, compare those observations with a genuinely untouched testing period and a monitored demo run.