The US jobs headline looks healthy, but the dollar’s first move does not last. Before deciding that the market is behaving strangely, look below the newest payroll number. The previous two months may have changed as well.
Payroll revisions help you distinguish a fresh monthly estimate from an updated picture of the employment trend. For an FX trader, that distinction can improve the questions you ask about a release. It cannot tell you where a currency must trade next.
This guide uses invented numbers to explain the process. It does not report the latest US jobs figures, market forecasts or currency prices.
Why the first estimate changes
Nonfarm payrolls measure wage and salary jobs outside farming, using the Bureau of Labor Statistics’ establishment survey. An establishment is a worksite. As the BLS measurement guide explains, this survey counts jobs rather than unique people: someone on two payrolls can be counted twice.
The initial release arrives before all the information is available. The Employment Situation FAQ says initial monthly estimates are revised in each of the next two months as additional responses arrive and seasonal factors are recalculated. Seasonal adjustment attempts to remove recurring calendar patterns so the underlying change is easier to assess.
A revision therefore updates an estimate of past employment. It does not mean those jobs were suddenly created or destroyed on the day the revision was published. Keep the month being measured separate from the date when you learned more about it.
A simple example: three numbers, three meanings
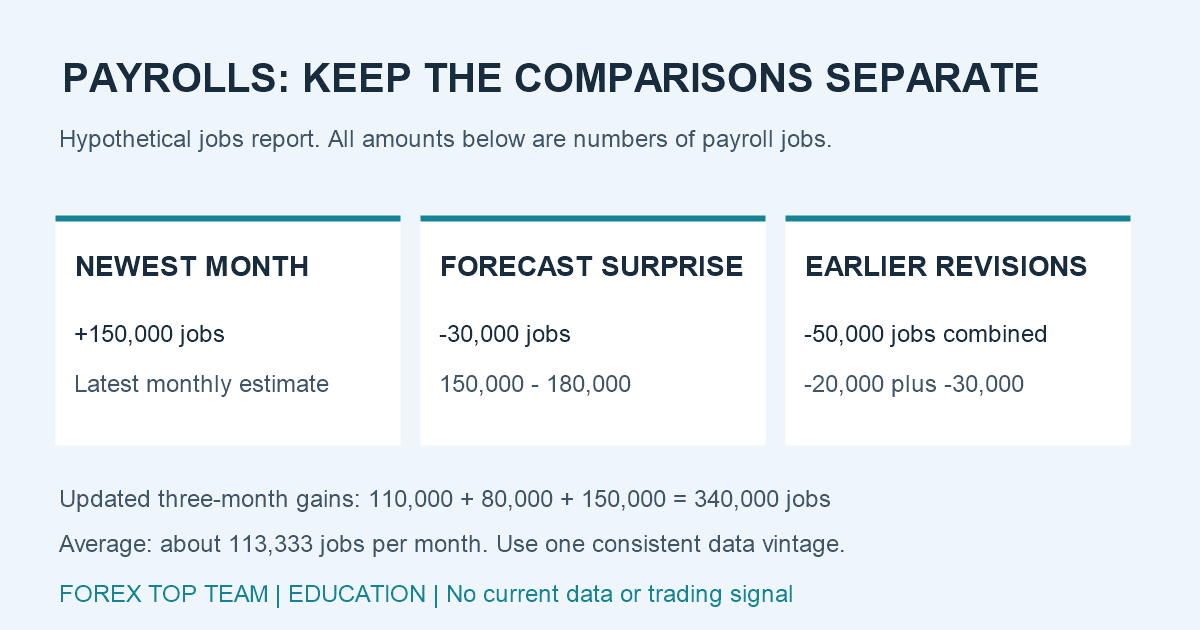
Imagine a hypothetical release showing 150,000 additional jobs in the newest month. Before publication, an imaginary survey median was 180,000. The headline surprise is 150,000 minus 180,000, or minus 30,000 jobs.
Now inspect the earlier estimates. Suppose the previous month’s gain changes from 100,000 to 80,000, a revision of minus 20,000. The month before that changes from 140,000 to 110,000, a revision of minus 30,000. The combined revision is:
(80,000 – 100,000) + (110,000 – 140,000) = -50,000 jobs.
The newest gain and the older revisions answer different questions. The latest monthly estimate is still plus 150,000. The minus 30,000 headline surprise compares it with a forecast. The minus 50,000 revision compares earlier months with their previously published estimates. None of those should be relabeled as the other.
Assume, just for this example, that the level before these three months is unchanged. The old two-month gains summed to 240,000. The newly reported three-month gains sum to 110,000 + 80,000 + 150,000 = 340,000. The difference is 100,000. That is a cross-release comparison of cumulative gains, not a replacement headline saying the newest month added only 100,000 jobs.
Rebuild the trend with consistent data
Using the same invented figures, the latest three-month average is 340,000 divided by three, or about 113,333 jobs per month. Mixing the old values with the new headline would give (140,000 + 100,000 + 150,000) divided by three, or 130,000. That second calculation uses inconsistent information.
Save a dated copy of each release. Economists call each published version a data vintage. A worksheet with separate columns for the previous vintage, current vintage and revision makes the comparison visible. Label the units: some tables express employment in thousands, so an entry of 150 means 150,000 jobs.
For a historical trading review, use what was available at the decision time. Feeding today’s revised history into an old signal can give your analysis information the trader could not have known then. Archive the release rather than silently replacing the evidence.
Do not confuse monthly and benchmark revisions
The CES FAQ describes an annual benchmark that re-anchors payroll estimates to more complete employment counts, largely from unemployment-insurance records. That is a different exercise from the routine monthly update.
BLS also publishes a monthly revisions table distinguishing first, second and final sample-based estimates. Its notes warn that the listed monthly changes do not incorporate later benchmark, seasonal-adjustment or other updates.
Before adding figures together, check that they describe compatible periods and versions. A benchmark change to an employment level is not automatically a single month’s change in hiring. A dramatic number becomes less useful when its definition disappears.
Turn the information into better FX questions
Start with an interpretation, not an instruction to buy or sell. In our hypothetical example, the newest gain misses the imagined forecast and the earlier gains are revised down. One reasonable hypothesis is that the employment picture is softer than the headline alone suggests.
Then write down what might challenge that hypothesis. Other parts of the release may tell a different story. The unemployment rate comes from a separate household survey, so it is not an alternative calculation of the payroll total. Read its definition before expecting the two measures to move together.
Compare the release with the expectations actually recorded beforehand. A published economist median is not a complete map of investors’ positions or interest-rate expectations. Our guide to policy surprises and currency reactions explains why the expected path matters alongside the headline.
If you observe FX and bond yields, record both timestamps and data sources. A price reversal alone does not prove that revisions caused it. Several pieces of information can arrive together, and a plausible explanation remains an interpretation unless the evidence supports it.
A practical release checklist
- Record the release date, time zone and forecast source before comparing actual and expected figures.
- Keep the newest monthly change, headline surprise and combined revisions in separate fields.
- Recalculate any trend using a consistent vintage and clearly labeled units.
- Separate monthly revisions from benchmark changes and payroll jobs from household employment.
- Preserve uncertainty; an economic interpretation does not replace your trading risk limit.
For practice, take one archived jobs release and rebuild its three-month average from the figures available that day. Explain what changed in two sentences. Next, examine how the rest of the report agrees or disagrees. That habit creates a more useful review than turning every revision into a confident dollar forecast.