A headline says inflation has slowed. A second headline says prices rose again this month. If you trade currencies, which one should you pay attention to?
Both can be correct. The annual rate and the monthly change compare different periods, and an old price jump can drop out of the annual calculation. Understanding that arithmetic helps you read an inflation release before attaching a policy story or a trade to it.
This guide uses an invented price index. None of its values are actual CPI observations, analyst forecasts or current market prices.
Start with the price level and the comparison window
The Consumer Price Index, or CPI, tracks changes in a basket of consumer prices. An index level is not itself an inflation percentage. To calculate a percentage change, compare the later level with the earlier level of the same series.
The BLS guide to percentage changes explains the calculation: subtract the earlier index from the later one, divide by the earlier index, then multiply by 100. A twelve-month comparison uses the same month one year apart.
A falling inflation rate generally means prices are rising more slowly over the stated interval. It does not necessarily mean the price level is falling. Keep that distinction clear before describing a release as evidence that goods and services have become cheaper.
An old jump can lower the new annual rate
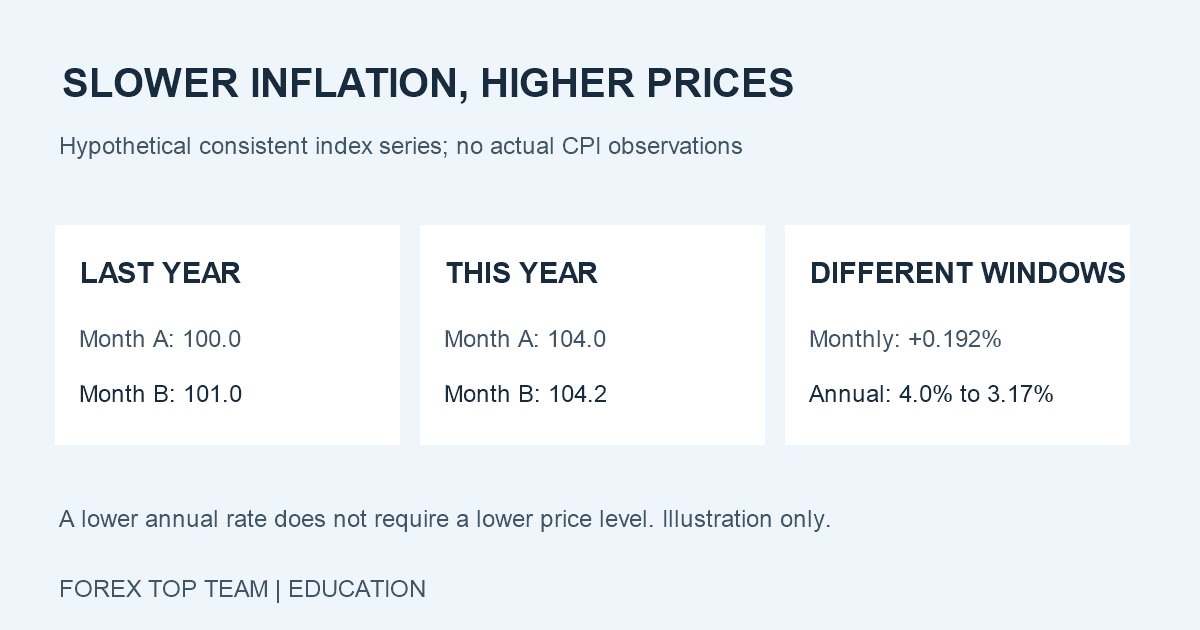
Imagine a hypothetical index of 100.0 in Month A last year and 101.0 in Month B last year. That was a 1% monthly increase. This year, the corresponding levels are 104.0 in Month A and 104.2 in Month B.
The annual change for Month A this year is (104.0 / 100.0 – 1) x 100 = 4.0%. For Month B it is (104.2 / 101.0 – 1) x 100, or approximately 3.168%.
Yet this year’s index rose between those two months: (104.2 / 104.0 – 1) x 100 is approximately 0.192%. Prices increased in the invented series while annual inflation slowed from 4.0% to about 3.17%.
This illustrates a base effect: the earlier comparison value changes as the twelve-month window advances. The large increase between last year’s two months is replaced by a smaller increase this year. A lower annual reading does not, by itself, tell you that the latest month had no price pressure.
Separate recent momentum from the comparison base
Read the latest monthly change alongside several earlier monthly observations. One month gives recent information, but it can also reflect temporary movement in a narrow component. A sequence can help you ask whether the change is broad or concentrated.
When calculating a multi-month change, use the endpoint index ratio or compound the monthly factors. Simply adding rounded monthly percentages is only an approximation. A twelve-month rate and a change between two annual-average index levels also answer different questions.
The purpose is to keep your comparisons consistent. You are not trying to force every measure to produce the same narrative. Write down the series, interval and calculation before deciding whether the recent momentum supports the annual headline.
Seasonal adjustment needs its own label
Some prices move in recurring seasonal patterns. Seasonal adjustment estimates and removes those recurring influences so short-term comparisons can be more informative. An adjusted monthly figure is different from an unadjusted monthly figure.
The BLS explanation of adjusted and unadjusted CPI data describes their different uses and the annual recalculation of seasonal factors. Review the label and revision policy of the exact series you use.
Our hypothetical example keeps one series consistent throughout; it does not combine adjusted and unadjusted values. In an actual US CPI release, distinguish the usual seasonally adjusted monthly figures from the unadjusted twelve-month changes. Do not stitch those two sets of levels together to manufacture a trend.
A data explanation is not a currency forecast
Once you understand the numbers, ask what new information they contain relative to expectations. A lower annual figure can be unsurprising if the earlier comparison base was already known. Conversely, an unexpected monthly change may attract attention even when the annual rate falls.
Use a forecast source you can identify and record when its forecast was collected. A survey median is a summary of estimates, not a direct observation of every trader’s positioning. If you cannot verify a consensus, describe the data without claiming it beat or missed an invented forecast.
Then examine the policy interpretation as a hypothesis. Our guide to policy surprises explains why the expected future path matters alongside a single decision. An inflation release is one piece of that assessment, and a currency pair still compares two economies.
Build a release note you can check later
Before the next release, prepare a small table containing the series name, monthly and annual measures, adjustment status, prior values and any documented forecasts. After publication, enter the official values and clearly distinguish revised figures from the original release.
For any market reaction you record, include observation timestamps, timezone, currency-pair quote direction and the source of the prices. Keep a short reaction window separate from a daily return. Other announcements can interfere with a clean interpretation.
Finally, write two separate sentences: one explaining the inflation arithmetic, and one stating what market evidence would support your policy interpretation. If that evidence is missing, leave the second sentence uncertain. Your next useful step is to compare several releases this way, rather than treating every falling annual rate as an automatic currency-selling signal.