Your EUR/USD chart shows a large volume bar, but a friend’s chart shows something smaller. Which broker is right? Before treating either bar as confirmation of a breakout, check what each feed is actually counting.
In retail FX, the word volume can refer to quote activity rather than the amount of currency traded. That distinction changes how you interpret a spike, compare brokers and test a volume filter. This guide gives you a practical way to label the evidence without pretending that one chart represents the whole market.
All counts and ratios below are hypothetical teaching examples. No live volume data, broker comparison or strategy performance is claimed.
Ask what the bar measures
MetaTrader 5’s volume-indicator documentation describes forex volume as the number of ticks, or price changes, within the interval. That is different from executed-trade volume measured in contracts or monetary units.
A tick-volume count of 900 therefore does not mean 900 lots, 900 customers or USD 900 million changed hands. It tells you about the updates represented by that data series. Check the symbol and indicator settings instead of assuming every field called volume has the same definition.
Also separate tick history from tick volume. A history file can contain individual updates and their timestamps; a candle’s tick-volume field summarizes activity over a bar. The summary alone cannot reconstruct every quote or its sequence.
Why two feeds can disagree
Foreign exchange trading is spread across dealers and trading venues. Much of it takes place over the counter, meaning transactions are arranged through counterparties rather than a single universal exchange order book.
The BIS review of the FX execution landscape explains the market’s fragmented structure and variety of execution methods. A retail chart is a particular window into that structure, not a consolidated record of all global transactions.
Different feeds may have different quote sources, processing and update frequencies. Bar boundaries can differ too. Before blaming a discrepancy on missing trading activity, check the provider’s data description, symbol specification and timestamps. A difference in counts alone does not establish its cause.
This also means you cannot infer a broker’s total customer activity from its tick-volume bars. More updates do not prove more customers traded, and fewer updates do not prove worse execution. Those claims require different evidence.
Use a local baseline, with limits
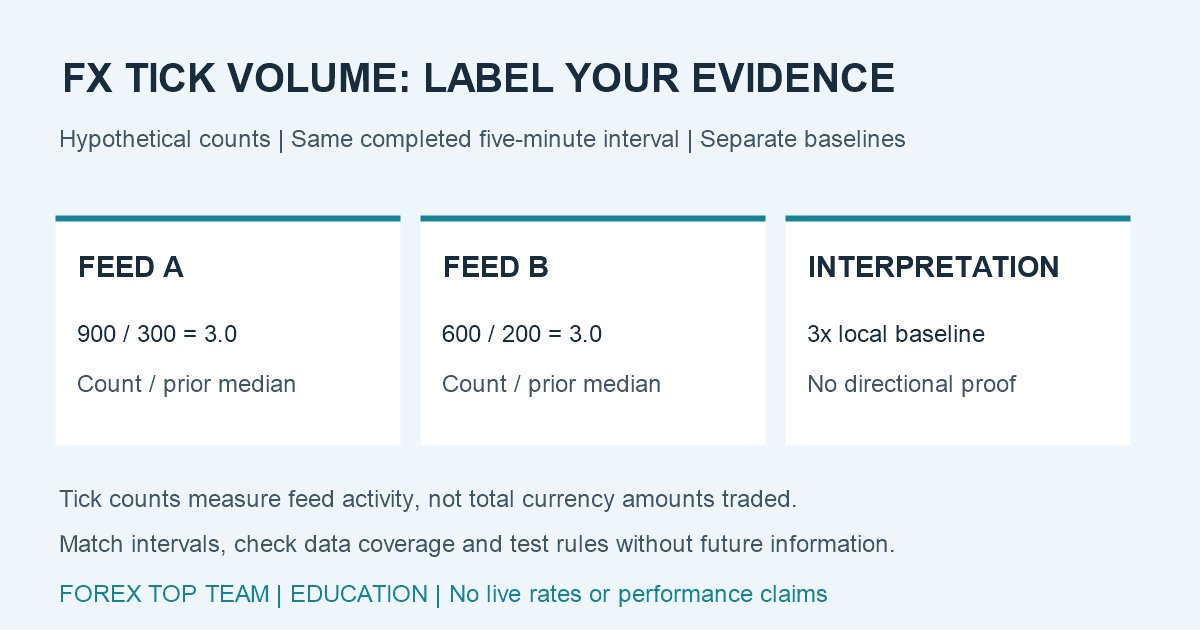
Suppose two hypothetical feeds report activity for exactly the same completed five-minute interval:
- Feed A: 900 ticks, against a previously calculated median of 300 for comparable intervals.
- Feed B: 600 ticks, against its own comparable median of 200.
Define a simple activity ratio as the current count divided by that feed’s historical baseline:
Feed A: 900 ÷ 300 = 3.0. Feed B: 600 ÷ 200 = 3.0.
The raw counts disagree, but both bars are three times their own baselines. This is a descriptive comparison, not proof that the feeds capture identical information or that a breakout will continue.
Choose the reference sample before evaluating the signal. For example, compare the same five-minute time slot across earlier comparable sessions, using only information available before the current bar. Record the sample length, holiday treatment and timezone. A quiet overnight baseline is a poor comparison for a busy session overlap.
The median is the middle observation after sorting the sample. It can reduce the influence of an unusually large historical count, but it does not fix missing data or a changed feed. If the baseline is zero or unavailable, flag the ratio as undefined rather than forcing a misleading number.
A spike does not identify the winning side
A tall tick-volume bar says little by itself about why quotes changed. Do not label it institutional buying, selling pressure or hidden accumulation without evidence supporting that interpretation.
Even executed volume needs context. Every completed transaction has a buyer and a seller. Measures of aggressive buying or selling require a classification method, such as identifying the side initiating a trade; a plain total-volume bar does not provide that classification.
MetaTrader 5’s Depth of Market guide distinguishes exchange time-and-sales information from non-exchange market-depth functionality. Inspect what your actual instrument supplies. An order-book quantity is not the same measurement as completed-trade volume, and neither is interchangeable with tick count.
Test the filter on the feed you will use
If your strategy requires activity above a threshold, freeze the rule before checking results. Specify the symbol, timeframe, server, volume field, baseline calculation and whether the bar must be complete.
Using the final tick count of an unfinished bar in a historical entry decision can introduce information that was unavailable at entry. Either wait for the close or reproduce the information available at the decision timestamp.
Then evaluate the rule on a separate period without repeatedly retuning it. A second feed can be a useful sensitivity check, but differences are diagnostic questions, not a contest to select the most profitable report. For the data-sequence issue, read why tick data changes an EA backtest.
Your practical volume checklist
- Label the field: tick count, executed volume or displayed order-book size.
- Record the provider, instrument, timeframe and bar-boundary timezone.
- Compare completed intervals with an appropriate earlier baseline.
- Investigate missing records or feed changes before interpreting a spike.
- Keep directional claims separate from activity measurements.
- Include spreads, execution and independent testing before treating a filter as useful.
For your next chart review, write one sentence describing exactly what the volume bar counts. Then compare an ordinary interval with an unusually active one on the same feed. That small discipline makes your interpretation clearer while leaving room for what the data cannot tell you.