
One currency offers a higher interest rate than another. Does that make it the more attractive currency to hold? Before answering, ask a second question: how much purchasing power might inflation take away?
That is where real interest rates help. They add an inflation adjustment to a nominal rate, the quoted rate before that adjustment. For an FX trader, the useful habit is comparing both currencies consistently, then checking what changed. A real-rate comparison can organize your analysis; it cannot produce a reliable buy or sell signal by itself.
All rates and calculations below are hypothetical educational examples. Countries A and B are fictional, and none of these figures describes today’s market.
Separate the quoted rate from purchasing power
The ECB’s explanation of nominal and real interest rates connects the distinction to what money can buy. A positive cash return can still leave a saver with less purchasing power when prices rise faster.
A common approximation is:
Real rate ≈ nominal rate − inflation rate.
For forward-looking analysis, use an inflation expectation covering the same period as the nominal return you are assessing. For a backward-looking calculation, use the inflation actually realized over that period. Label the choice: a forecast and an observed outcome answer different questions.
Subtraction is an approximation, not an exact compounding formula. For a simple one-year scenario with fixed nominal return i and assumed inflation π, the purchasing-power return is (1 + i) ÷ (1 + π) − 1, using decimal rates. With 4.50% and 3.00%, that gives approximately 1.46%, rather than the 1.50% shortcut.
A higher nominal rate can lose the comparison
Imagine comparable one-year instruments in two fictional countries, ignoring taxes, credit differences and transaction costs. Use the approximate subtraction method consistently:
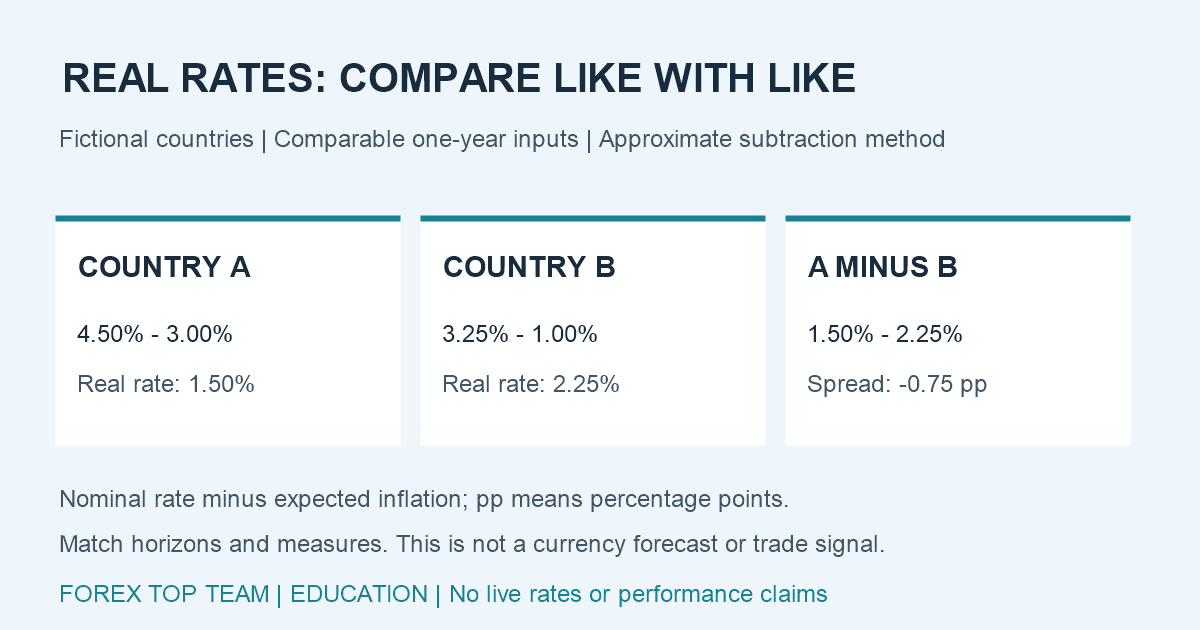
- Country A: nominal rate 4.50%, expected one-year inflation 3.00%, approximate real rate 1.50%.
- Country B: nominal rate 3.25%, expected one-year inflation 1.00%, approximate real rate 2.25%.
A’s nominal advantage is 4.50% − 3.25% = 1.25 percentage points. Its approximate real-rate spread against B is 1.50% − 2.25% = −0.75 percentage point, or −75 basis points. One basis point is 0.01 percentage point.
Write the subtraction direction at the top of your worksheet: A minus B. Otherwise, a negative number can quietly reverse the interpretation. Also label these as percentage-point differences, not percentage changes.
This comparison concerns purchasing-power returns in each country’s own price basket. It does not calculate an investor’s return after exchanging between the two currencies. Exchange-rate movements can outweigh the interest difference, and hedging introduces its own pricing and costs.
Track the change as well as the level
Now suppose A’s expected inflation falls from 3.00% to 2.50%, while every other input stays unchanged. Its approximate real rate becomes 2.00%. The A-minus-B spread becomes −0.25 percentage point.
A still has the lower approximate real rate, but the gap has narrowed by 0.50 percentage point, or 50 basis points. “Still lower” and “improving relative to B” can both be true.
That distinction is useful when reviewing an announcement. Record the previous estimate, the new estimate and their sources before describing the relative change. Do not assume the revision was unexpected: market participants may have anticipated it already.
The ECB’s monetary-transmission overview explains how expectations about future official rates affect longer-term interest rates and how policy can influence exchange rates. It describes economic channels, with uncertain and variable lags, rather than a fixed FX response.
Match the horizon before doing the subtraction
A familiar shortcut is subtracting the latest annual CPI reading from today’s policy rate. That can be a useful labelled snapshot, but it mixes a backward-looking price change with an overnight policy setting. It is not automatically the expected return from holding a one-year investment.
Before comparing countries, choose the question and horizon. Are you reviewing next year’s prospective purchasing power, a five-year bond yield, or the current policy stance? Use inputs that fit that question, and document the remaining mismatch.
Check inflation definitions too. Headline consumer inflation, core inflation and a central bank’s preferred index are not interchangeable. A survey forecast can also refer to a calendar-year average rather than the coming twelve months. Similar labels do not guarantee comparable periods.
A breakeven rate is not a pure forecast
You may see inflation expectations inferred from the yield gap between conventional US Treasuries and Treasury Inflation-Protected Securities, known as TIPS. With comparable maturities, that gap is commonly called breakeven inflation or inflation compensation.
A Federal Reserve research note on TIPS explains why the gap also reflects inflation-risk and liquidity premiums. A premium is compensation associated with bearing a particular risk or holding a less liquid security.
Consequently, a changing breakeven does not prove that inflation expectations changed by exactly the same amount. Nor is a quoted TIPS yield a direct reading of next month’s central-bank policy. Keep market yields, survey expectations and model estimates distinct in your notes.
A practical checklist for your FX review
- Name the two currencies, the subtraction direction and the comparison horizon.
- Record the nominal-rate instrument and inflation measure for each side.
- Use consistent observation times and state the timezone for actual market data.
- Separate the level of the spread from its latest change.
- Note forecast uncertainty, risk premiums and any maturity mismatch.
- Keep exchange-rate exposure and execution risk outside the purchasing-power arithmetic.
For the next step, read why a rate hike can weaken a currency, which connects decisions with prior expectations. Then build a two-country worksheet using clearly dated sources. If you cannot explain an input’s horizon, leave the conclusion open rather than turning a neat subtraction into a confident trade.