An attractive equity curve is the beginning of an EA investigation, not evidence that a trading system is ready for deployment. A credible validation process asks whether the apparent edge survives independent data, realistic trading costs, parameter uncertainty and operational constraints. The aim is to reject fragile systems before their weaknesses are funded with real capital.
This article presents a research protocol for FX Expert Advisors. It does not evaluate a particular commercial EA or claim any live performance. Numerical examples are hypothetical.
1. Write the trading hypothesis before optimisation
State what behaviour the strategy is intended to exploit and why that behaviour might persist after costs. A trend-following model, for example, should have a documented relationship between entry logic, holding period and expected market persistence. A mean-reversion model should define the conditions under which a price deviation is considered temporary and the conditions under which that assumption fails.
Record the EA version, parameter bounds, currency pairs, trading sessions, data source and decision rules before examining the final evaluation sample. A detailed research log makes it possible to distinguish a tested hypothesis from a strategy assembled to explain an already-observed chart.
2. Match simulation detail to the strategy
MetaQuotes documents the available tick models, delay settings and forward-test split in the MetaTrader 5 Strategy Testing guide. Real-tick mode and execution-delay emulation can improve the test setup, but a simulation remains dependent on the available broker history and its assumptions. The MQL5 explanation of tick generation is useful when reviewing how price events are supplied to an EA.
A bar-opening model may be adequate only if the strategy’s decisions and execution logic are compatible with that restriction. Strategies using intrabar stops, trailing exits, limit orders or rapid entries need closer scrutiny of the bid/ask path. The historical candle high and low do not tell you the order in which prices were reached.
Validate symbol specifications, lot increments, contract size, commissions, financing, margin rules and account-currency conversion. Record missing data and broker time-zone changes. A strategy that depends on a session boundary can change behaviour if the timestamp convention shifts.
3. Protect the final evaluation sample
Use a chronological development period for choosing parameters and a later period for evaluation. If you keep changing rules after seeing evaluation results, that period becomes part of development. Re-labelling it as out-of-sample does not restore independence.
A walk-forward procedure repeatedly selects parameters using information available at a historical cutoff, then evaluates the frozen selection in the next interval. Combine only those forward intervals when reporting the walk-forward result. Indicator warm-up may legitimately use earlier observations, but it must not use prices from after the decision time.
The number of variants tried matters. Searching hundreds of settings and reporting only the winner creates a selection problem even if each individual report looks statistically persuasive. Preserve the count of trials and compare parameter neighbourhoods. An isolated optimum deserves more scepticism than a reasonably stable region with an economic explanation.
4. Recalculate the edge after costs
Define gross expectancy per completed trade as E = p × W − (1 − p) × L, where p is the win probability, W the average gross win and L the average gross loss, expressed on a consistent basis. Net expectancy subtracts the average all-in implementation cost, unless those costs are already included in the measured outcomes.
For example, a 45% win rate, average gross win of 18 pips and average gross loss of 12 pips produce gross expectancy of 1.5 pips per trade. An average round-trip cost of 1.2 pips reduces that to 0.3 pips. Raising the cost assumption to 1.8 pips makes expectancy −0.3 pips. These numbers illustrate sensitivity; they do not estimate any actual system.
Do not double-count spread. If simulated fills already use executable bid and ask prices, their effect is already present in trade P&L. Commission, slippage and financing still need separate reconciliation according to the simulator’s implementation. Repeat the analysis under adverse spreads, execution delays and selected gap scenarios.
5. Measure risk from marked-to-market equity
Closed-trade balance can hide open losses, particularly in averaging or grid strategies. Measure drawdown from equity including open positions. For equity E(t) and its preceding running peak P(t), percentage drawdown is 1 − E(t)/P(t). Also report the duration of underwater periods, maximum margin usage and exposure concentration.
A 20% decline requires a 25% gain to recover; a 50% decline requires a 100% gain. Recovery arithmetic is nonlinear, so a strategy’s risk cannot be summarised by its average monthly return. Include the worst historical windows and explain the regimes represented by the sample. The observed maximum drawdown is a sample outcome, not a ceiling on future losses.
Stress-test the whole portfolio rather than adding standalone drawdowns. Several EAs can share the same USD exposure, volatility sensitivity or execution window. Historical diversification may disappear in a liquidity shock.
6. Set operational acceptance criteria
- Research integrity: a versioned strategy, trial log and untouched final evaluation period.
- Robustness: acceptable results under documented cost stress and reasonable parameter perturbations.
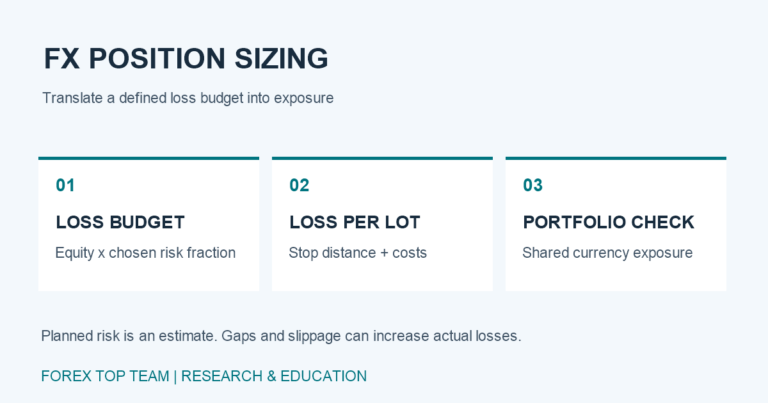
- Risk: explicit equity, margin and concentration limits in account-currency amounts.
- Execution: logs for intended orders, actual fills, rejects and latency.
- Monitoring: predefined conditions for investigation or suspension when live behaviour diverges.
Forward observation on a demo account can identify logic and operational problems, but it does not establish real-money fill quality. Any later live pilot needs its own authorisation and risk budget. Expansion should depend on evidence accumulated under the agreed protocol, rather than on a short profitable streak.
A professional validation report should make it easy to reproduce the test and identify why it might fail. That transparency is more valuable than a headline return unsupported by execution assumptions.
Educational analysis only. Historical and simulated results do not guarantee future performance. This framework does not recommend an EA purchase or authorise live trading.