Research edition: October 8, 2026
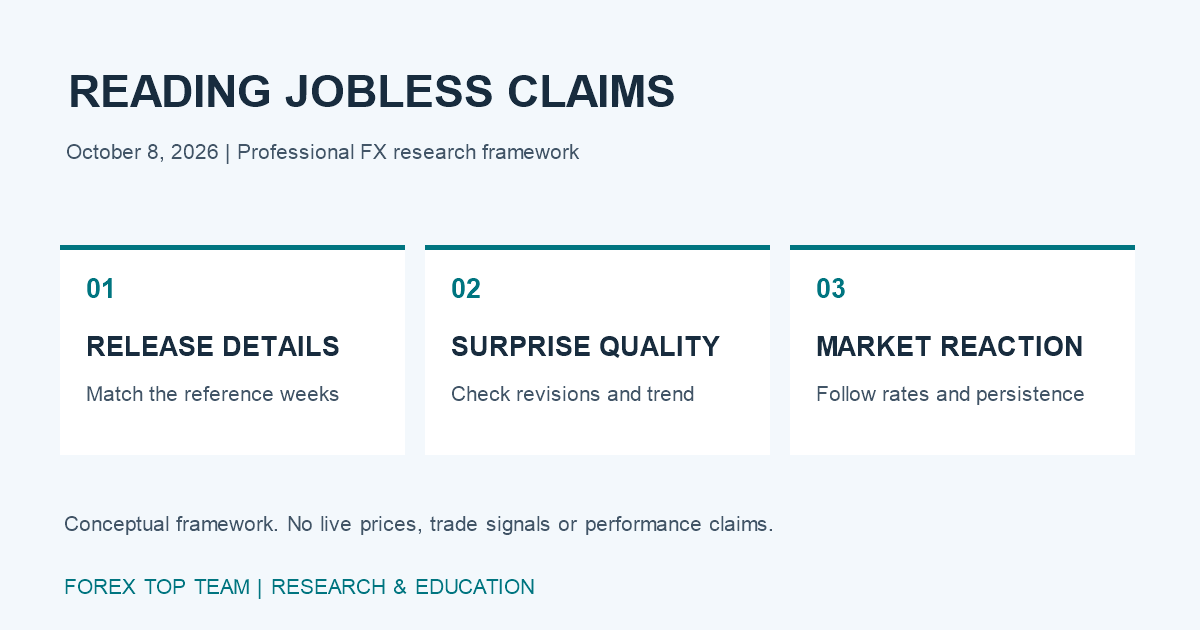
Weekly unemployment claims provide timely information about part of the U.S. labour market, but a currency interpretation requires more than comparing one number with a forecast. The release contains different measures, reference weeks and revisions. Its market impact also depends on the information already priced into interest rates. A disciplined process separates the data surprise from the narrative and the subsequent trading response.
This October 8, 2026 research edition explains that process without reporting a live release or a current consensus forecast. Every numerical example is hypothetical. The framework is designed to make an event review reproducible rather than to produce an automatic buy or sell instruction.
Understand what each measure describes
Initial claims concern new applications for unemployment insurance. Continuing claims describe ongoing insured unemployment under the relevant reporting definitions. Neither measure is identical to total unemployment, payroll employment or the entire population looking for work. Eligibility and administrative features mean that insurance statistics cover a particular part of labour-market conditions.
The Department of Labor's weekly release distinguishes initial claims, insured unemployment, seasonally adjusted series and unadjusted figures. It also labels the weeks to which the measures refer. Compare like with like and preserve those reference dates in an analytical note. Do not assume that every figure in the same release describes the same week.
Reconcile the headline with revisions
Suppose initial claims are hypothetically reported at 205,000 against an expected 210,000. The five-thousand difference is one surprise measure. If the previous week is revised upward substantially, the broader interpretation may differ from the headline comparison alone. Write down both the forecast error and the revision before assigning a labour-market conclusion.
A four-week moving average can reduce some weekly noise, but it is not an independent observation: adjacent averages share three of four underlying weeks. In an illustrative sequence of 190,000, 200,000, 210,000 and 220,000, the mean is 205,000. Replacing the earliest observation with 230,000 increases the average to 215,000. The arithmetic explains the change; it does not by itself establish its economic significance.
Holiday timing, weather, processing effects and seasonal adjustment can complicate interpretation. Investigate unusual movements with the detail available in the release and subsequent revisions. Do not classify every weekly jump as a structural deterioration or every decline as proof that hiring is accelerating.
Separate the consensus error from the economic conclusion
A consensus forecast is a benchmark created by a particular survey or data provider. Record the provider and the forecast timestamp. Comparing a release with an estimate revised after publication creates a misleading surprise measure. For research, retain the forecast that was observable before the release and document how missing forecasts are handled.
A standardised surprise might divide the forecast error by a historical standard deviation of forecast errors. That normalisation is useful only if the sample is comparable and the historical forecast data are reliable. A small denominator or changing forecasting process can produce an apparently dramatic statistic without a proportionate economic change. Report the construction alongside the result.
Locate the signal within the policy discussion
Currency markets may respond to claims through expectations for growth, inflation pressure and monetary policy. The dominant channel can change with the macroeconomic regime. Labour resilience might support higher rate expectations in one environment while reassuring risk markets in another. A fixed rule that lower claims always strengthen the dollar cannot capture those differences.
Review other information available at the time: payroll trends, unemployment rates, wage measures and relevant central-bank communications. Treat the claims release as an incremental update to that information set. If a release is consistent with the existing view, its effect may be limited even when the absolute level attracts attention.
Test whether rates confirm the FX response
Record the immediate exchange-rate move and the associated change in the relevant part of the yield curve. A dollar rally without sustained rate repricing may reflect positioning, short-term liquidity or another simultaneous event. Conversely, consistent movement in rate expectations and FX provides a more coherent observation, although correlation alone does not establish causation.
Define the observation windows in advance. Compare a pre-release baseline, an immediate interval and a later persistence interval. Do not select whichever horizon makes the initial hypothesis look strongest. Align data timestamps, and distinguish mid-price movement from a realistically executable trade.
For a hypothetical release, the dollar rises initially, yields barely move and the currency retraces the advance within the chosen later interval. Describe this as an initial response that failed to persist. It would be inaccurate to report a durable policy repricing merely because the first few quotes moved in the expected direction.
Evaluate execution separately from interpretation
Fast releases can widen spreads and produce variable fills. Estimate the cost of acting on the signal and compare it with the size and duration of the observed move. An accurate economic interpretation does not guarantee a profitable implementation. Slippage, delays and stop execution can materially change the outcome of an event-driven strategy.
Keep a release record containing the reference weeks, forecast source, actual values, revisions, trend measures, relevant policy context and market response. Note competing announcements and missing information. The final conclusion should state both what the data support and what cannot be inferred from one weekly reading.
Source: U.S. Department of Labor, weekly unemployment insurance claims release. The release defines the statistical components; the surprise calculations and reaction framework above are original hypothetical examples.
Educational analysis only. Weekly claims are one input to a broader assessment and do not establish a guaranteed currency-trading opportunity.