Your usual 20-pip stop worked in a quiet market. Today, price keeps reaching it before moving in the direction you expected. Should you widen the stop, reduce the position, or skip the setup?
Average True Range, usually called ATR, can help you describe how much the market has been moving. It cannot tell you which direction comes next. Used carefully, it gives your trade planning some context rather than another prediction to follow.
This guide uses hypothetical EUR/USD prices and account figures throughout. It contains no live market observations or claims about today’s volatility.
What ATR actually measures
ATR averages a measure called true range across a chosen number of bars. True range considers both the current bar’s high-to-low distance and its distance from the previous close. This allows a gap between bars to affect the measurement.
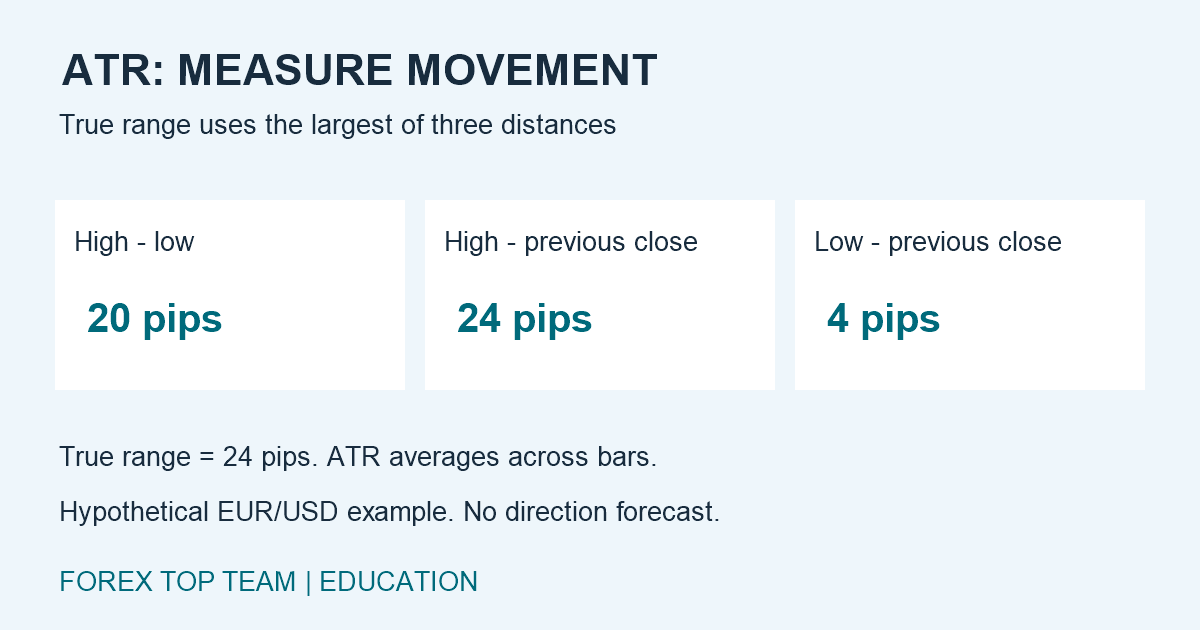
For each completed bar, calculate the largest of these three quantities: high minus low, the absolute value of high minus the previous close, and the absolute value of low minus the previous close. The official MetaTrader 5 documentation describes the calculation. Check your platform’s averaging method as implementations can differ.
A larger reading describes larger recent ranges. Both strong rallies and sharp declines can lift it. Therefore, an ATR increase alone is not a buy signal, a sell signal, or proof that a reversal is approaching.
Convert the reading into something you recognize
Suppose a completed EUR/USD bar has a high of 1.1020, a low of 1.1000 and a previous close of 1.0996. EUR/USD is quoted in US dollars per euro, and one conventional pip is 0.0001.
- High minus low: 0.0020, or 20 pips.
- High minus previous close: 0.0024, or 24 pips.
- Low minus previous close: 0.0004, or 4 pips.
The true range is 24 pips. Notice that the candle itself covered 20 pips, but the gap from the previous close adds information. This single-bar result is not the ATR: the indicator still needs to average true ranges over its selected period.
If the resulting ATR is 0.0012, that is 12 pips on EUR/USD. A five-decimal display can make points and pips easy to confuse: a platform point of 0.00001 would make 120 points equal 12 pips. Confirm the instrument specifications before using an automated calculation.
Match the timeframe to your decision
A 14-period ATR on an hourly chart summarizes hourly bars. A 14-period ATR on a daily chart summarizes daily bars. These are different measurements, even though the setting says 14 in both places.
Keep the pair, timeframe, period and smoothing method consistent when comparing observations. Record whether you used the last completed bar or the still-changing current bar. For a rule tested at bar close, use the completed-bar value when applying that rule.
You might compare today’s hourly reading with earlier hourly readings collected at a similar point in the trading session. That makes the comparison more useful than mixing a quiet overnight observation with an active session without recording the difference.
Use ATR to question your stop, not replace your analysis
Imagine a setup requiring a 20-pip stop. With an hourly ATR of 10 pips, that stop is two times ATR. With an hourly ATR of 25 pips, it is 0.8 times ATR. The arithmetic does not establish which setup will succeed. It simply shows that the same stop represents different distances relative to recent activity.
A stop at two times ATR is not automatically correct. You still need a reason for the exit, such as the failure of a setup’s price structure, and evidence from testing that the rule fits the strategy.
Decide the stop before entering. If a valid setup needs more room than your plan permits, skipping it is a reasonable decision. Widening an existing stop after price approaches it increases the planned loss unless exposure is reduced, and may abandon the original trade logic.
A wider stop needs a fresh size calculation
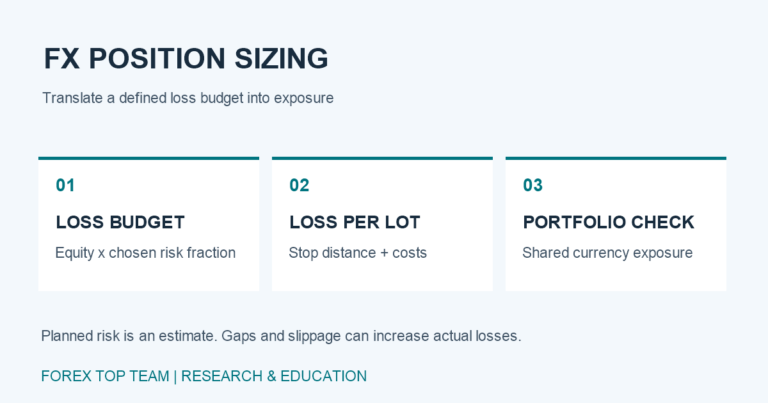
Suppose your hypothetical cash risk budget is $50. For a USD account, assuming a standard EUR/USD lot of 100,000 euros, each pip is worth $10 per lot. A 20-pip stop gives $50 divided by $200, or 0.25 lots before costs. A 40-pip stop gives $50 divided by $400, or 0.125 lots.
If the broker allows only 0.01-lot increments, round the second size down to 0.12 lots. Then include commissions, financing when relevant, and an execution allowance. These examples exclude those costs and do not guarantee the actual loss.
CME Group’s position-sizing lesson connects stop location with the chosen cash risk. Our forex position-sizing guide explains the calculation and cost adjustments in more detail.
Know when yesterday’s ranges stop helping
ATR looks backward. A quiet reading before a major announcement cannot cap the size of the next move. Nor does a high reading guarantee that wide ranges will continue. Spreads, slippage and weekend gaps need separate attention; ATR does not measure your broker’s execution quality.
Before relying on an ATR rule, test it across different conditions with realistic costs. Keep some data separate from the period used to choose the settings. Compare the rule with your existing approach rather than assuming a more complicated indicator improves the outcome.
Your practical checklist
- Record the instrument, timeframe, period and completed-bar ATR.
- Convert price units into pips correctly.
- Explain why the proposed stop invalidates the setup.
- Recalculate size when the stop distance changes.
- Check event exposure and execution assumptions separately.
Try logging ATR beside your next ten practice setups. Record the planned stop, the range after entry and the actual exit. You are looking for useful context and repeatable decisions, not a multiplier that promises to prevent losses.