
GoldenBoy EA Telegram channel!
https://t.me/+wN80MiU5XQlmODA9
Installing Forex expert advisors (EA) follows nearly the same pathway as that of custom indicators, with the minor difference that the EA files are attached to the “Experts” folder and not the Indicators folder. This is how it is done. Again, the assumption is that the EA was coded within the MQL4 environment, as only EAs coded with the MQL4 can be added are compatible with the MT4 platform.
Step 1: Transferring files
- Create or download an EA. Keep note of the location of where you saved it.
- Select and copy the EA file you wish to install.
Step 2: Adding the EAs to the Right Folder
First, open the instance of the MT4 Forex Trading platform where you want to add the expert advisor. When this is open, click on File on the top navigation menu, and then click on “Open Data Folder” in the drop-down menu. This will open the data folder on your computer.

Step 3: Add the Expert Advisor(s) to the Data Folder
In the open Data Folder, click on MQL4 -> Experts. This opens the Experts folder. This is the folder where the EAs will be added.


Step 4: Paste the .mq4 or .ex4 EA file into the “Experts” folder
Use the Ctrl + C to copy and paste the expert advisor files from their native location to the open Experts folder, then restart your MT4 platform by closing it and opening it again. By now, the Expert Advisors will be available for use from the Experts tab in the navigation menu on the left.

Please note that this process replaces the old method where the EAs could be copied and pasted directly into the Experts folder, which was a standalone subfolder in the folder housing the MT4 client.
When adding an EA to the chart, go to the Navigator menu on the left hand side of the platform interface, click on the + sign beside Expert Advisors to show the attached EAs. Click on the one to be added to the platform. This opens a pop-up window where the trader can set the parameters within which the EA will function. When this is concluded, click OK to attach the EA.
Step5: Chose the correct Chart. 15mins, GOLD(XAUUSD)

Step 6: install EA to chart mt4


Please change the Initial lots, depend on your Initial Fund.
Click the automatic trading tab, and when the face on the upper right of the chart changes to the Smile mark, the automatic trading start is complete.
Parameter setting, reference value
- Change the initial lot value according to the initial funds.
Example: Lot guide (standard account)
Low risk: 0.01 lot with $ 2,000 in funds
Middle risk: 0.01 lot with $ 1,000 in funds
High risk: 0.01 lot per $ 500 of funds
- In the case of middle risk with funds of 2,000 dollars, the initial lot will be 0.02.
- If you use a micro account, you can start it on a scale that is 1/100 of the standard account, so you can start from a minimum of $ 5.
Approximate value: In the case of funds of 2,000 dollars
- Change only the initial lot value according to the funds and risk / return.
〇 Middle risk / middle return (monthly interest rate around 25%)
Time frame: 15 minutes
- When the index is announced, a new position entry stop function is attached.
- As a market situation judgment function, entry points are carefully selected using the correlation between the US 10-year bond yield and the US dollar index.
Magic number = 123
Total profit (pips) = 100
Total loss cut (pips) = 0
Settlement profit when touching the other side of CCI (pips) = 70
Stop-loss rate (%) = 0
Max buy positions = 25
Max sell positions = 25
Continue trade = true
Deliver mail = false
Display information = true
Compound interest = true
Initial lot = 0.02 (changed according to funds and risk / return)
CCI period = 14
CCI sell entry value = 65
CCI buy entry value = -65
Avaraging function = true
Avaraging spacing (pips) = 500
Avaraging magnification = 2.5
trail function = false
Trail Start Profit (pips) = 10
Depth of loss cut on trail (pips) = 10
Allowable spread (pips) = 100
Restoring the Price Avaraging coefficient Number of Price Avaraging times = 2
Whether to apply the logic of the initial entry to Price Avaraging = true Settlement profit (pips) = 70
Candlestick width that can be picked up (pips) = 500
Time axis of Price Avaraging candlestick = 5 Minites
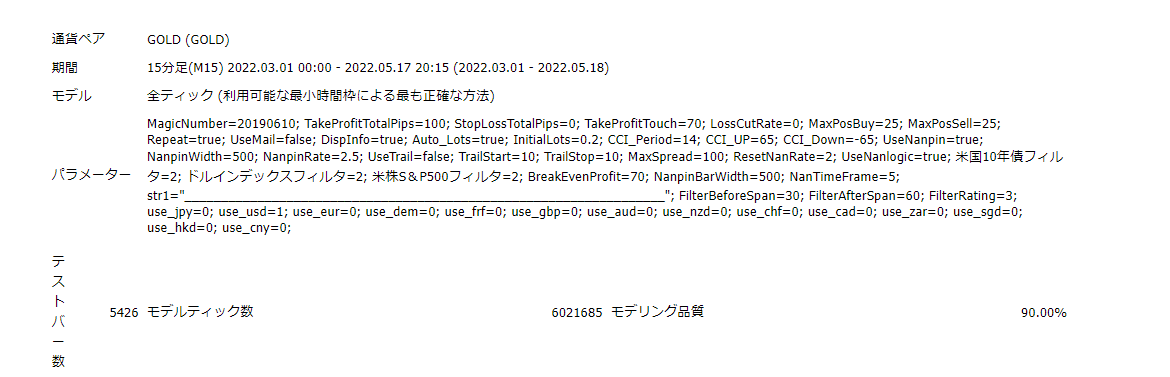
〇 High risk and high return (monthly interest 100-300%)
Time frame: 15 minutes
- When the index is announced, a new position entry stop function is attached.
- As a market situation judgment function, entry points are carefully selected using the correlation between the US 10-year bond yield and the US dollar index. Magic number = 123
Total profit (pips) = 100
Total loss cut (pips) = 0
Settlement profit when touching the other side of CCI (pips) = 70
Stop-loss rate (%) = 0
Maximum number of positions Buy = 25
Maximum number of positions Sell = 25
Whether to continue at all payments = true
Whether to deliver mail = false
Whether to display information = true
Whether to calculate compound interest = true
Initial lot number = 0.04 (changed according to funds and risk / return)
CCI period = 14
CCI sell entry reference value = 65
CCI buy entry reference value = -65
Whether to use the Price Avaraging function = true
Price Avaraging spacing (pips) = 500
Price Avaraging magnification = 2.5
Whether to use the trail function = false
Trail Start Profit (pips) = 10
Depth of loss cut on trail (pips) = 10
Allowable spread (pips) = 100
Restoring the Price Avaraging coefficient Number of Price Avaraging times = 2
Whether to apply the logic of the initial entry to Price Avaraging = true Settlement profit (pips) = 70
Candlestick width that can be picked up (pips) = 500
Time axis of Price Avaraging candlestick = 5 Minites
〇 Low risk low return (monthly interest rate around 10%)
Time frame: 15 minutes
- When the index is announced, a new position entry stop function is attached.
- As a market situation judgment function, entry points are carefully selected using the correlation between the US 10-year bond yield and the US dollar index. Magic number = 123
Total profit (pips) = 100
Total loss cut (pips) = 0
Settlement profit when touching the other side of CCI (pips) = 70
Stop-loss rate (%) = 0
Maximum number of positions Buy = 25
Maximum number of positions Sell = 25
Whether to continue at all payments = true
Whether to deliver mail = false
Whether to display information = true
Whether to calculate compound interest = true
Initial lot number = 0.01 (changed according to funds and risk / return)
CCI period = 14
CCI sell entry reference value = 65
CCI buy entry reference value = -65
Whether to use the Price Avaraging function = true
Price Avaraging spacing (pips) = 500
Price Avaraging magnification = 2.5
Whether to use the trail function = false
Trail Start Profit (pips) = 10
Depth of loss cut on trail (pips) = 10
Allowable spread (pips) = 100
Restoring the Price Avaraging coefficient Number of Price Avaraging times = 2
Whether to apply the logic of the initial entry to Price Avaraging = true Settlement profit (pips) = 70
Candlestick width that can be picked up (pips) = 500
Time axis of Price Avaraging candlestick = 5 Minites
Revenue image from backtesting
Low risk low return
Average monthly interest 52% (10.3 times in about one and a half years!) $ 10,000 ⇒ $ 103,784


- In the back test, the risk is increasing because the US 10-year bond yield and the US dollar index cannot be taken into consideration as the market conditions. Roughly, it is assumed that the risk will be reduced to about 30% of the back test.
High risk and high return
Average monthly interest 309% (8.7 times in about two and a half months!) $ 10,000 ⇒ $ 877,298
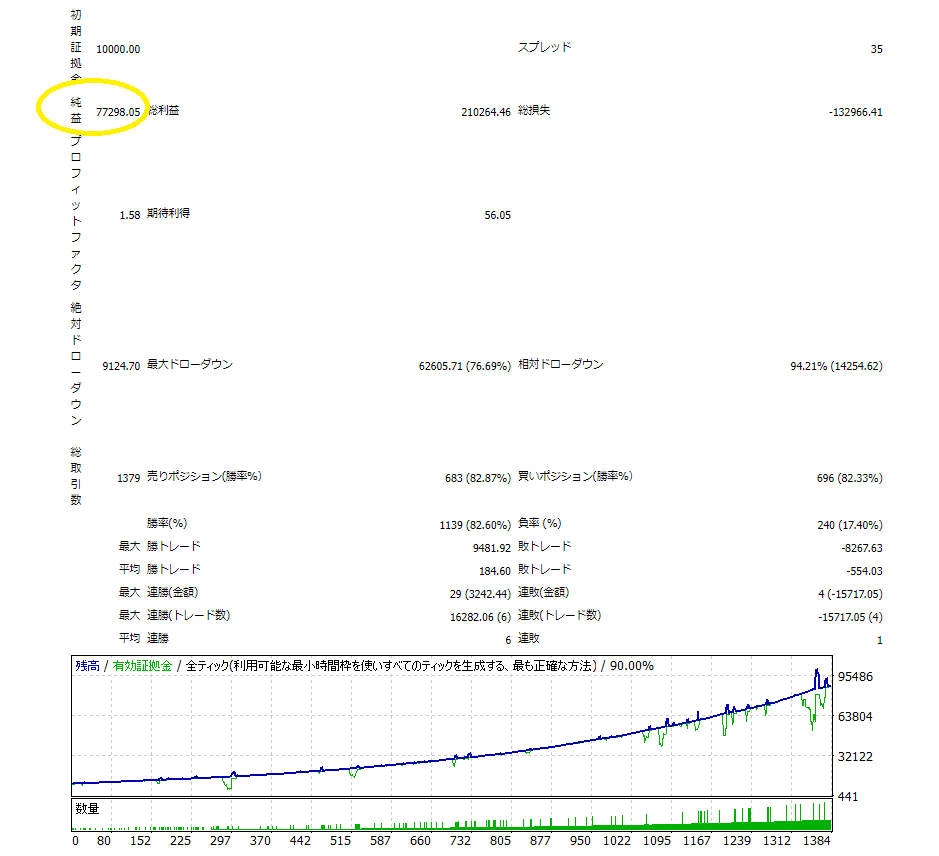
- In the back test, the risk is increasing because the US 10-year bond yield and the US dollar index cannot be taken into consideration as the market conditions. Roughly, it is assumed that the risk will be reduced to about 30% of the back test.